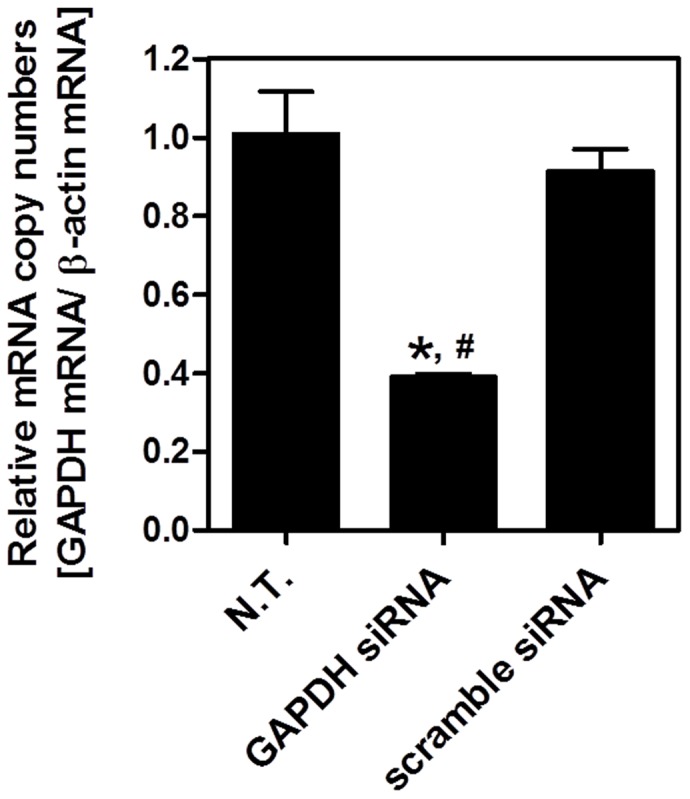
Figure 6. siRNA transfection to the liver by tissue suction.

GAPDH siRNA and scramble siRNA were transfected by using type II device. mRNA expression of GAPDH after 24 h of transfection was measured. Each value represents means + SD (n = 3 [N.T.], n = 4 [GAPDH siRNA and scramble siRNA]). There was a statistically significant difference between 3 groups (ANOVA; F = 99.72, p<0.0001). Post-hoc analysis (Bonferroni’s test) was performed. *p<0.001 versus N.T. #p<0.001 versus scramble siRNA. All mice were alive at the end of the experiment.
