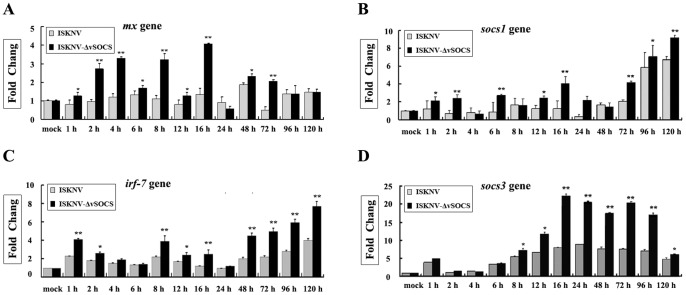
Figure 7. Real-time RT-PCR analysis of mx (A), socs1 (B), irf7 (C), and socs3 (D) genes expressed the MFF-1 cells in response to ISKNV and ISKNV-ΔvSOCS viruses.
Expression of β-actin from the same RNA samples was used as control. The expression levels of mx, irf7, socs1, or socs3 gene at 0 h was arbitrarily set as 1. The grey and black columns indicate the gene expressions in cells infected with wild-type ISKNV and ISKNV-ΔvSOCS viruses, respectively. All data were analyzed by Q-gene statistics add-in, followed by unpaired sample t-test. Error bars represent the mean ± S.D. (n = 3). *P<0.05, **P<0.01.

