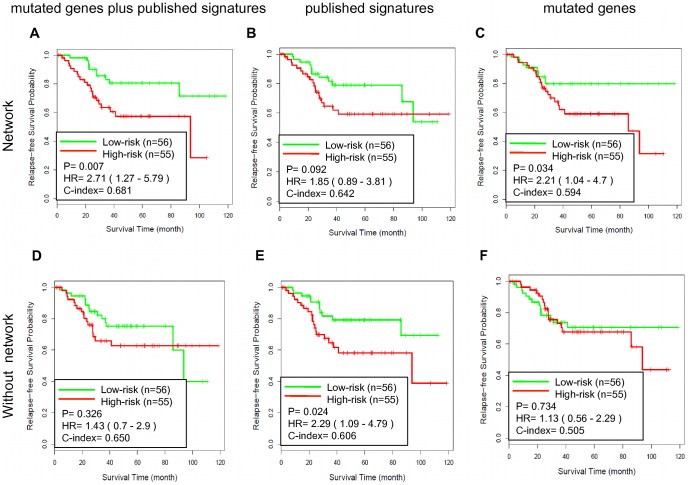
Figure 5. Testing the GSE14333-derived SSVM prognostic models on GSE17536.
Kaplan-Meier survival curves for patient subgroups identified in GSE17536 using models developed based on GSE14333 with different gene sets. (A) The NEM signature based on network analysis with the seed nodes including 208 genes in published signatures and 549 mutated genes, N = 487; (B) The NE signature based on network analysis with the seed nodes including 208 genes in published signatures, N = 546; (C) The NM signature genes based on network analysis with the seed nodes including 549 mutated genes, N = 435; (D) the union of 208 genes in published signatures and 549 mutated genes, N = 753; (E) 208 genes in published signatures, N = 208; (F) 549 mutated genes from CanProVar, N = 549.

