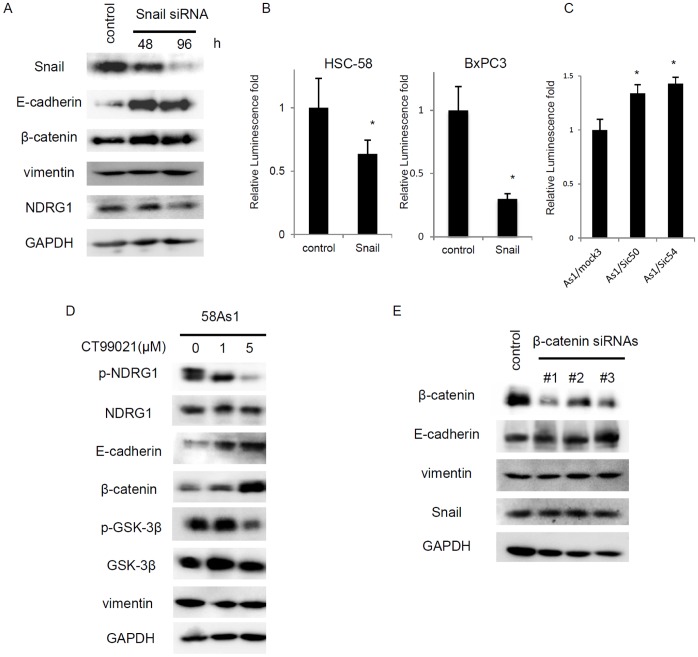
Figure 5. Enhancement of E-cadherin promoter activity by NDRG1 knockdown in highly metastatic gastric cancer cell.
(A) Comparison of protein expression levels of E-cadherin, β-catenin, NDRG1 and vimentin when transiently treated with Snail siRNA for 0, 48 and 96 hr by western blot analysis in HSC-58 cell. (B) E-cadherin promoter-driven luciferase activity in the absence or presence of Snail expression in HSC-58 and BxPC-3 cells. E-cadherin-luc was transfected with or without pcDNA3-Snail, and the luciferase activity was measured. Each column is average of triplicate trials (*p<0.05). (C) Comparison of E-cadherin promoter-driven luciferase activity (E-cadherin-luc) in As1/Mock3, As1/Sic50 and As1/Sic54. Each column is average of triplicate trials (*p<0.05). (D) The effect of CT99021 on protein expression of NDRG1 and various EMT-related molecules by Western blot analysis. 58Asl cells were treated with indicated doses of the drug for 24 hr. (E) The effect of β-catenin knockdown by its siRNAs on expression of E-cadherin. HSC-58 cells were transfected with siRNAs for 24 hr, and total cell lysates were analyzed by Western blot analysis.

