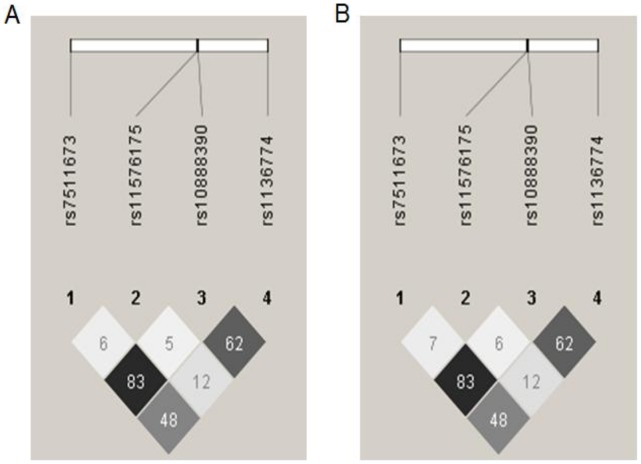
Figure 1. Linkage disequilibrium (LD) plot of the CTSS locus in cases and random subcohort.
This Figure shows LD (linkage disequilibrium) values (r2) between each tag SNP in (A) cases and (B) subcohort. Each diamond contains the LD value (r2) between the two SNPs that face each of the upper sides of the diamond, ex: the LD between rs10888390 (SNP N°3) and rs1136774 (SNP N°4) is r2 = 0.62; the darker the diamond, the higher the LD value. There seems to be no difference in the LD pattern at the CTSS locus between the cases and the subcohort.

