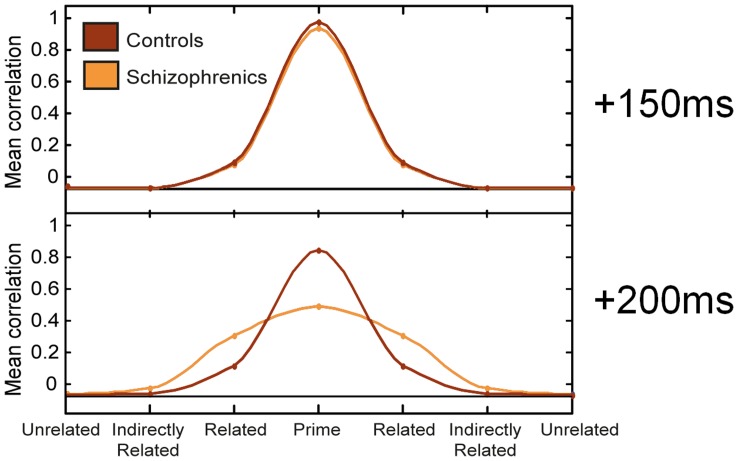
Figure 11. Statistical spreading activation of the control vs. schizophrenic networks.
The mean correlation across trials of the network state with the prime concept (1), its strongly related concept (2), indirectly related concept (9) and an unrelated concept (16) was computed for 150 ms and 200 ms after prime onset, separately for the control and schizophrenic network. For presentation purposes, the values of the related, indirectly related and unrelated patterns were replicated twice and interpolation was performed between each value in order to get a smooth symmetric wave-like graph. Data is based on the high Type-I prime ratio data from simulation 1. Only trials when the prime was pattern 1 were considered. See [17] for details.

