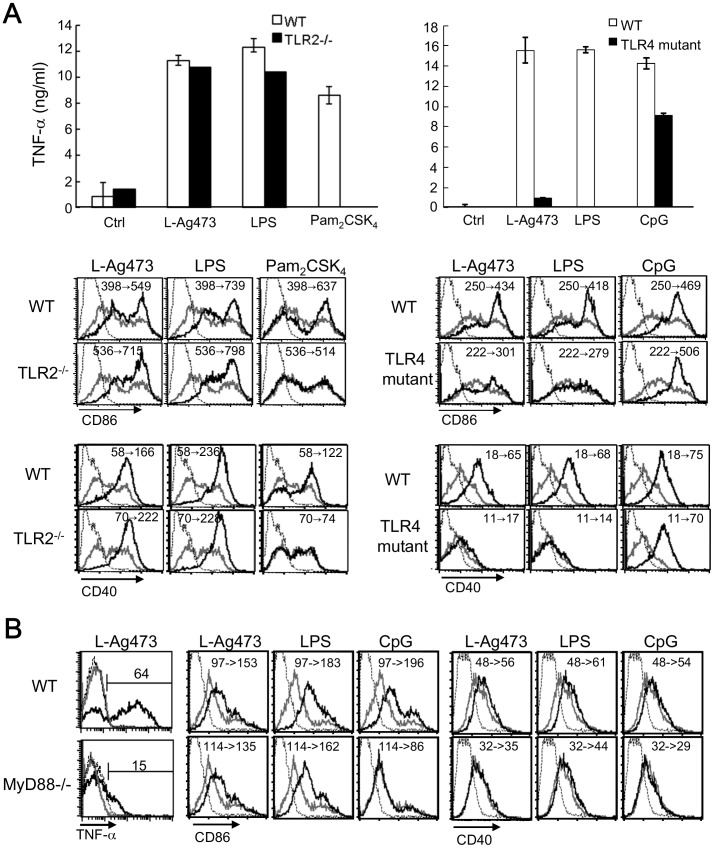
Figure 8. TLR4 was involved in the L-Ag473-induced BMDC activation.
DCs derived from C57BL6 (B6 WT), TLR2−/−, C3H/HeOuJ (C3H WT), C3H/HeJ (TLR4 mutant) (A) and MyD88−/− (B) mice were treated with L-Ag473 (100 ng/ml), LPS (20 ng/ml), Pam2CSK4 (50 ng/ml), or CpG DNA (100 nM). (A) TNF-α production was measured by ELISA. Data are shown as mean ± SD from triplicate DC cultures; NS p>0.05; *p<0.05; **p<0.01 (Student’s t-test), comparing TLR2−/−/TLR4 mutant to WT cells. (B) Maturation was determined by flow cytometry. Cells were treated with L-Ag473, LPS, Pam2CSK4, or CpG DNA (black line) or untreated (gray line) for 16 hours. Dotted line represents staining with an isotype-matched control Ab. The change of MFI from no treatment to stimuli treatment is shown on each picture. The expression of CD86 and CD40 was shown.

