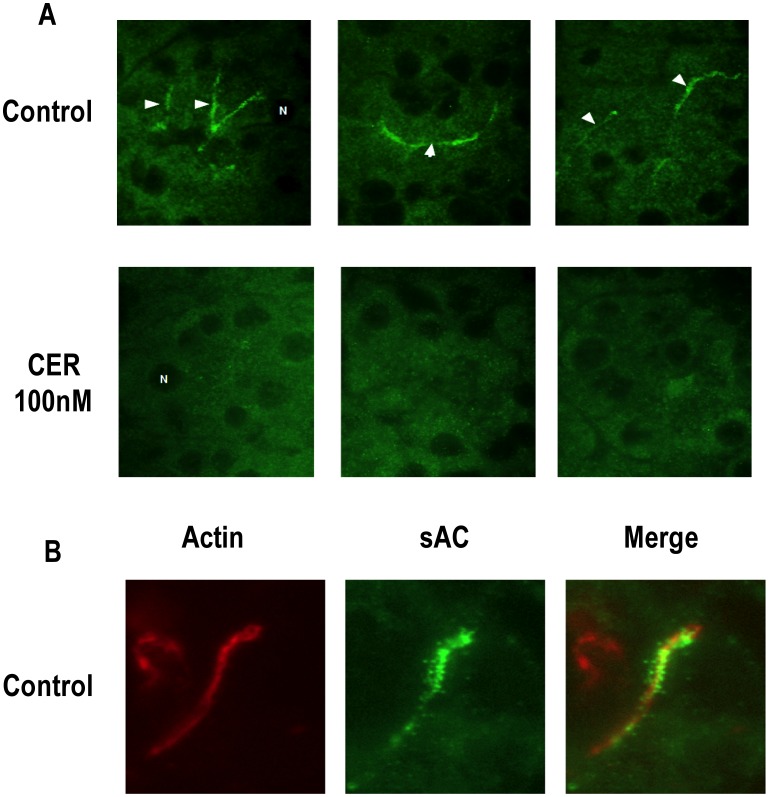
Figure 2. sAC is localized to the apical pole of acinar cell and undergoes translocation after cerulein (CER) stimulation.
Tissue was removed from control and CER treated rats and was probed for sAC and f-actin. (A) Pancreatic tissue was probed with antibodies to sAC (R21). sAC immunoreactivity was concentrated in the apical regions of the acinar cell (arrow heads), but labeling was also observed in the cytoplasm in control tissue (CTL). In CER hyperstimulation (CER) there was a loss of apical staining and the appearance of intense cytoplasmic puncta. 3 representative pictures from different experiments are shown. Representative nuclei are marked with and “N”. B) Control tissue probed for both sAC (green) and also f-actin (rhodaminne-phalloidin, red). In the merged co-localization image of sAC with f-actin is yellow.

