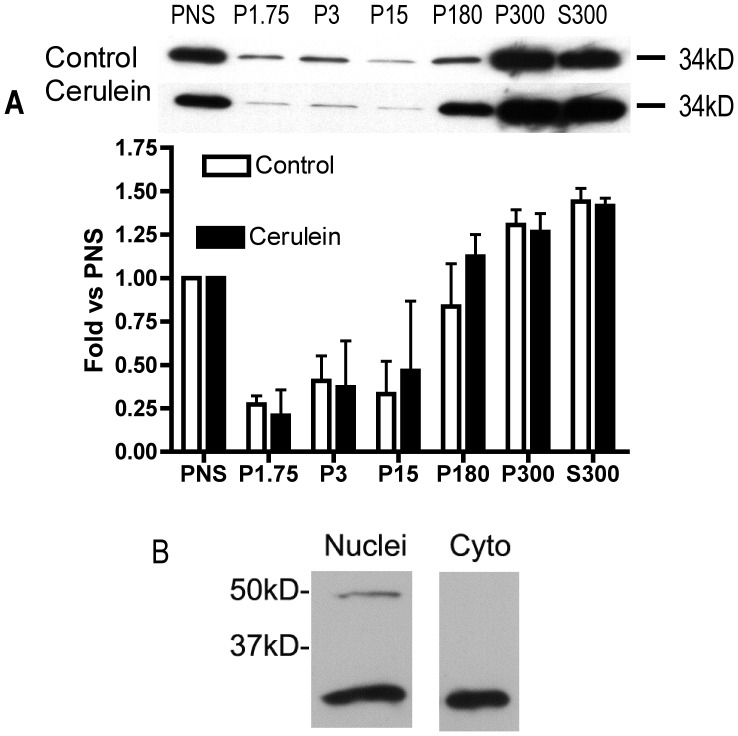
Figure 3. sAC is associated with specific subcellular fractions.
(A) Tissue was removed from control and CER treated rats and separated by differential centrifugation into various membrane fractions or cytosol followed by Immunoblot analysis of the 34 kD band of sAC. The top panel shows representative immunoblots and below is quantitation of all experiments (n = 3). (B) Immunoblot for sAC using Ab (R21) in cytoplasmic and nuclear protein extract from pancreatic acini (n>3).

