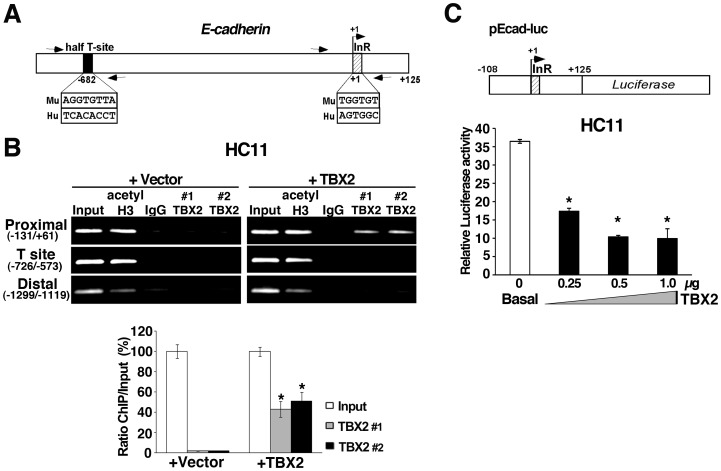
Figure 8. TBX2 bind to the E-cadherin promoter in vivo and represses E-cadherin transcription.
(A) Schematic of the E-cadherin/CDH1 promoter depicting the location of potential TBX2 binding sites [10]: half T-site (black box) and InR = Initiator element (hatched box), and of ChIP primers used in (B). (B) ChIP analysis shows in vivo binding of exogenous TBX2 to the most proximal region of the endogenous E-cadherin gene promoter in HC11 mammary epithelial cells. DNA derived from sheared chromatin fragments from HC11+vector and HC11+TBX2 was immunoprecipitated with two antibodies specific to TBX2 (#1 = Millipore AB4147; #2 = SC-17880x), an antibody specific to acetyl Histone 3, or normal rabbit IgG and quantified by semi-quantitative PCR. As a control, <1% of input chromatin was used in the PCR analysis. The bar graph on the bottom panel shows a quantification of the TBX2-specific ChIPs for the proximal (−131/+61) E-cadherin promoter as a function of the percentage of input chromatin. (C) Transient reporter assays of HC11 cells transiently co-transfected with a human E-Cadherin promoter (−108 to +125) luciferase reporter construct (pEcad-luc) in combination with pCDNA3 vector (basal) or increasing concentrations of pCDNA3-TBX2 (+TBX2), as indicated. One representative experiment of n = 3 biological replicates is shown; P-value: *p<0.05 (triplicate samples; Student t-test).

