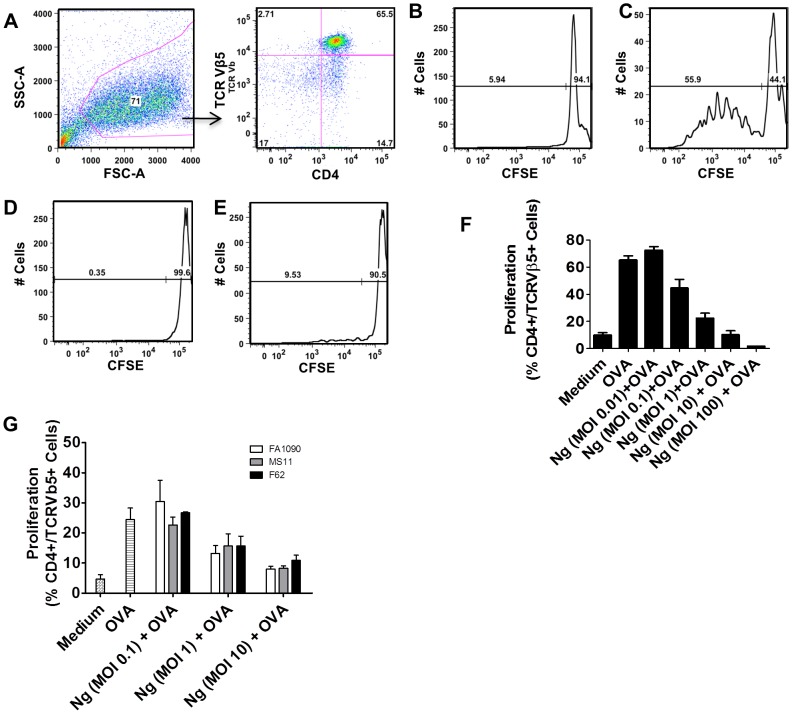
Figure 1. N. gonorrhoeae inhibits BMDC antigen-induced T cell proliferation.
BMDCs were exposed to N. gonorrhoeae at different MOIs with or without OVA for 24 hours and then co-cultured with CFSE-loaded OT-II T cells for seven days. T cell proliferation to OVA was assessed by flow cytometric analysis. A) Representative gating strategy of CD4+ Vβ5+ OT-II T cells. B) Representative T cell proliferation following co-culture with medium only-treated BMDCs. C) Representative T cell proliferation following co-culture with OVA (100 µg/mL) pulsed BMDCs. D) Representative T cell proliferation profile following co-culture with N. gonorrhoeae (MOI = 1) exposed BMDCs. E) Representative T cell proliferation following co-culture with N. gonorrhoeae (MOI = 1) plus OVA (100 µg/mL) pulsed BMDCs. F) Percentage of OT-II T cell OVA-induced proliferation with a dose range of N. gonorrhoeae (0.01–10 MOI)-exposed BMDCs. Data are mean ± standard deviation (N = 8–32). G. OVA (100 µg/mL) pulsed BMDC were treated with different N. gonorrhoeae strains (White bars: FA1090; Gray bars: MS11; Black bars: F62) at the indicated doses (MOI 0.1–10). Antigen-induced T cell proliferation was assessed after co-culture of the N. gonorrhoeae and OVA treated BMDC with CFSE-loaded OT-II T cells for seven days as noted above. The percentages of proliferated T cells are plotted. Data are mean ± standard deviation (N = 3).

