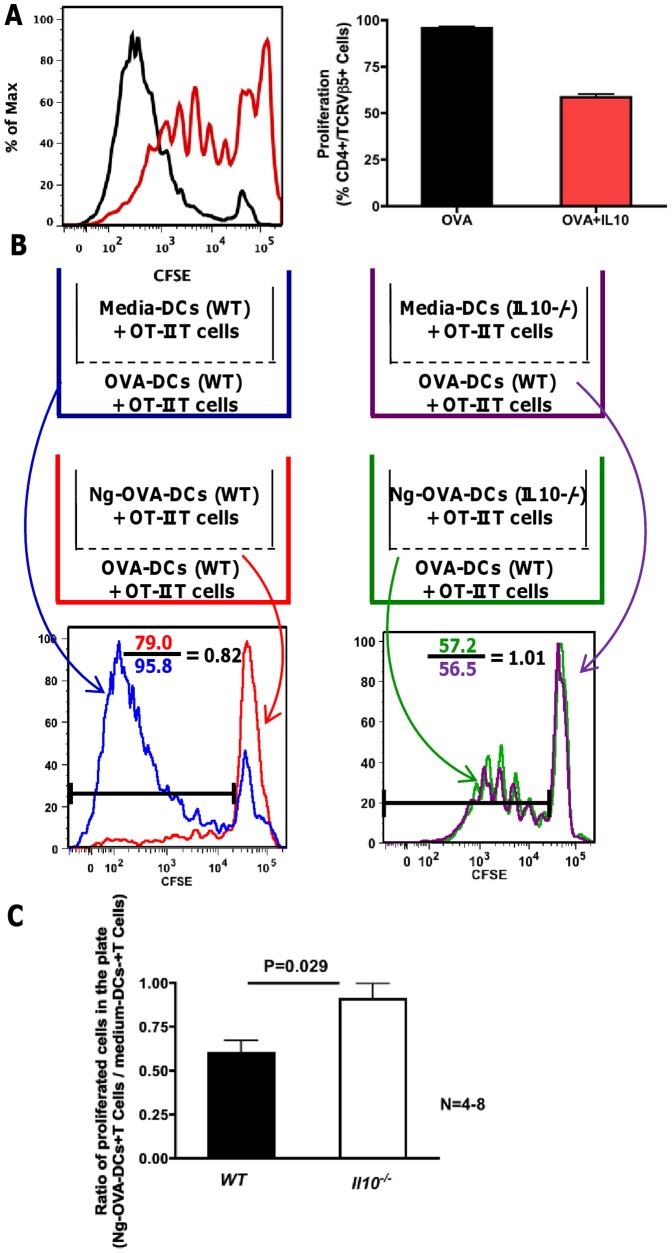
Figure 4. IL-10 inhibits OVA-DC-induced T cell proliferation.
OVA-pulsed dendritic cells were co-cultured with CFSE-loaded OT-II T cells with or without IL-10 for seven days. A) Representative histogram overlay and bar graph show T cell proliferation profiles following culture with OVA-pulsed DCs (black) or OVA-pulsed DCs+IL-10 (red). The bar graph shows the proliferation of OT-II T cell in the presence of OVA-pulsed DCs with and without exogenous IL-10 from three independent experiments. Data are mean ± standard deviation (N = 3). B) Transwell experiment scheme. WT OVA-DC with OT-II T cell co-culture was placed in all transwell plates. In the insert medium treated-DCs or N. gonorrhoeae-treated DCs from wild type or Il10−/− were co-cultured with OT-II T cells as indicated. T cell proliferation from the transwell plate is shown in the histogram overlays. OVA-induced T cell proliferation in the plate was inhibited by N. gonorrhoeae-treated wild type DCs in the insert (red) but not by wild type medium treated-DCs in the insert (blue). OVA-induced T cell proliferation in the plate was the same for N. gonorrhoeae-treated Il10−/− DCs in the insert (green) and medium treated Il10−/− DCs in the insert (purple). C) Ratio of proliferated T cells from transwell plates with inserts supplying N. gonorrhoeae-OVA-DCs or medium-DCs. Ratio of T cell proliferation in the plate was obtained by dividing the N. gonorrhoeae-OVA-DCs insert by medium-DCs insert. The black bars represent proliferation ratio from transwell plate supplied with wild type BMDCs in insert (N = 8), the open bars represent proliferation ratio from transwell plate supplied with Il10−/− BMDCs in insert (N = 4).

