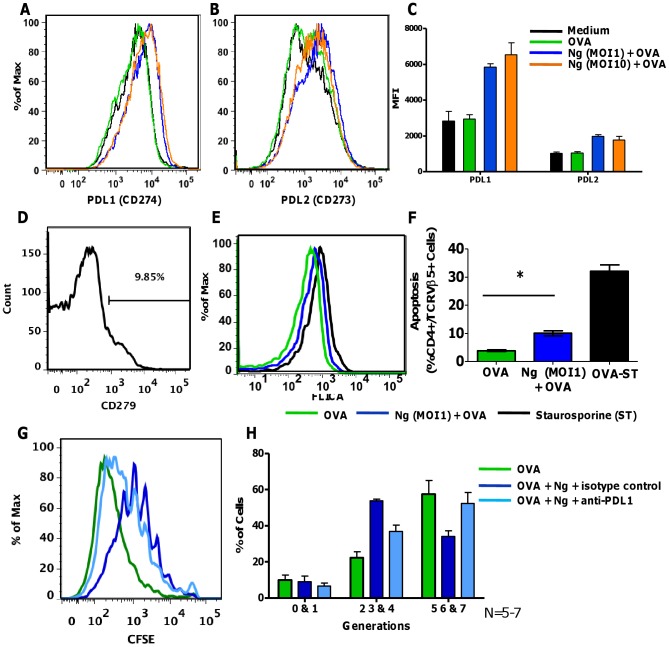
Figure 5. PD-L1 and PD-L2 are induced on N. gonorrhoeae exposed BMDCs.
BMDCs treated for 24 hours with medium only, OVA, N. gonorrhoeae (MOI = 1,10) with OVA were immunostained for flow cytometric analysis of CD273 and CD274 on DCs (B220−, CD11c+). Representative overlay histograms of: A) CD274 (PD-L1) and B) CD273 (PD-L2). C) Median fluorescence intensity (MFI) of PD-L1 and PD-L2 expression on BMDCs treated as indicated. D) Histogram of PD1 (CD279) expression on CD4+ Vβ5+ OT-II T cells prior to co-culture with BMDCs. E–F) Caspase 3&7 activity (FLICA) form CD4+ Vβ5+ OT-II T cells following co-culture with OVA or N. gonorrhoeae (MOI = 1) plus OVA (100 µg/mL) pulsed BMDCs. E) Representative overlay histograms of Caspase 3&7 activity (FLICA) from CD4+ Vβ5+ OT-II T cells following co-cultured with BMDCs for 24 hours. F) Percentage of apoptotic CD4+ Vβ5+ OT-II T cells following co-cultured with BMDCs for 24 hours. Data are mean ± standard deviation (N = 4 replicates). T cells treated with 1 µM staurosporine (ST) for 3 hours was used as positive control. G) Representative overlay histograms of OT-II T cell proliferation induced by BMDCs treated with OVA (green) versus N. gonorrhoeae (MOI = 0.1) with OVA plus anti-PD-L1 (1∶10 dilute, light blue), N. gonorrhoeae (MOI = 0.1) with OVA plus isotype control (1∶10 dilute, dark blue). H) Mean % ± SD of OT-II T cells proliferated through generations 0–1, 2–4, 5–7 following indicated culture conditions, N = 5–7.

