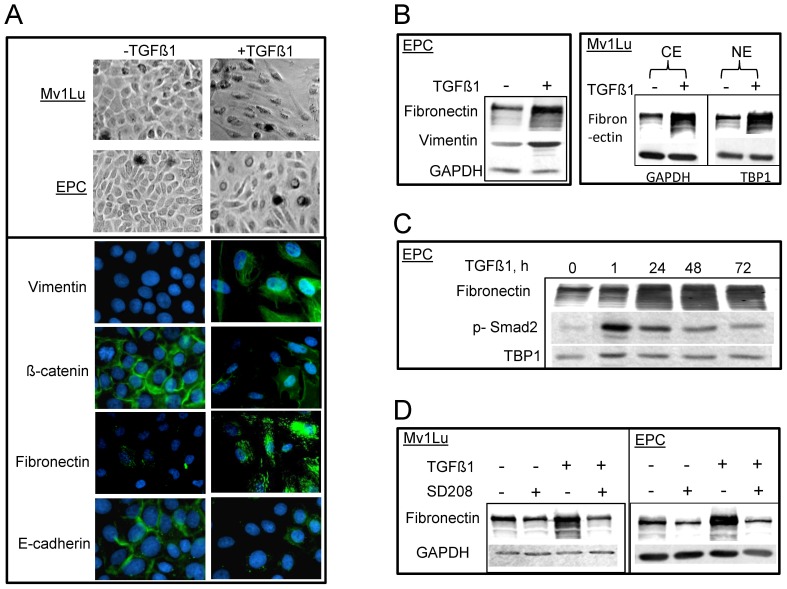
Figure 2. TGFβ1 induces EMT in both EPC and Mv1Lu cells.
A. Phase contrast images of morphology alterations after TGFβ1 stimulation in EPC and Mv1Lu cells. Hallmarks for mesenchymal phenotype including vimentin, β-catenin, E-cadherin and fibronectin (green immunofluorescence) are shown in EPC cells 3 days after TGFβ1 treatment (right, lower panel). DAPI staining (blue) represents cell nuclei. B. The expression of EMT markers using western blotting from whole cells extracts in EPC cells. Right upper panel shows expression of fibronectin in both cytoplasmic extract and nuclear extract in the presence or absence of TGFβ1treatment (2 days) in Mv1Lu cells. GAPDH and TBP1 were used as loading control of cytoplasmic extract and nuclear extract, respectively. C. Expression of fibronectin and p-Smad2 in nuclear extract of EPC cells after different incubation time with TGFβ1. D. Effect of inhibition of fibronectin expression upon TGFβ R1 inhibitor -SD208 treatment in both EPC and Mv1Lu cells. Whole cell extracts were used for western blotting. Other details were shown in Figure 1.

