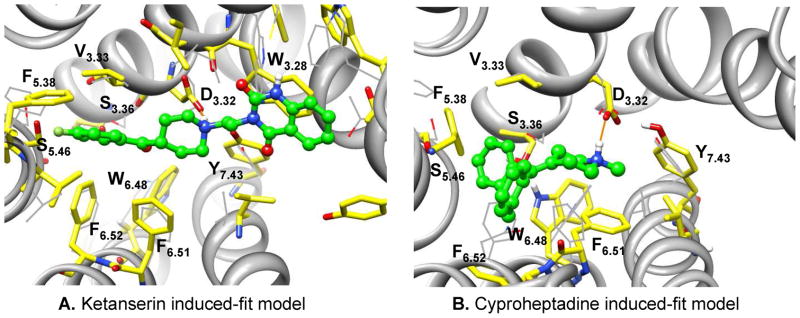
Figure 5.
Conformational changes upon binding ligands ketanserin (A) and cyproheptadine (B). Induced-fit model (stick, carbon atoms colored yellow) is superimposed on the initial homology model (thin line, carbon atoms colored grey), highlighting the binding-site conformational changes in molecular dynamics simulation. The transmembrane helixes in the initial homology model are shown in ribbon representation and are omitted in the induced-fit models for clarity purpose. Carbon atoms of ligands are colored in green. The salt-bridge interaction between the tertiary amine of the ligand and the conserved D3.32 is illustrated with orange line. Molecular images were generated with UCSF Chimera.

