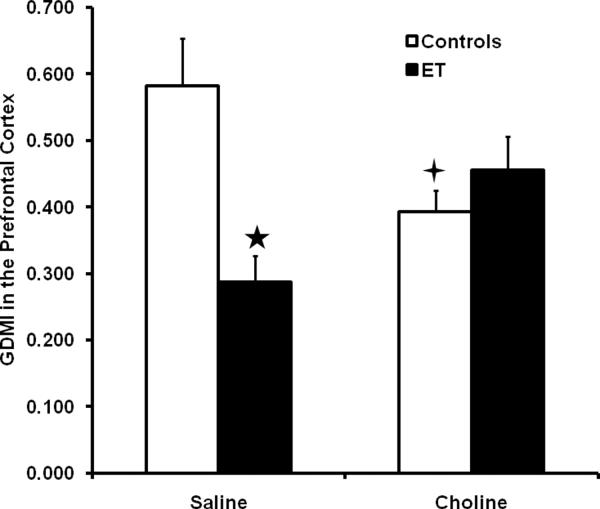
Figure 1.
Average Global DNA Methylation Index (GDMI) values in the PFC. Data are collapsed across sex and control group. Error bars represent the SEM. The GDMI is inversely related to the amount of DNA methylation. The five-pointed star indicates a significant difference from both the saline-supplemented control group and the choline supplemented ET group. The four-pointed star indicates a significant difference from the saline-supplemented control group.

