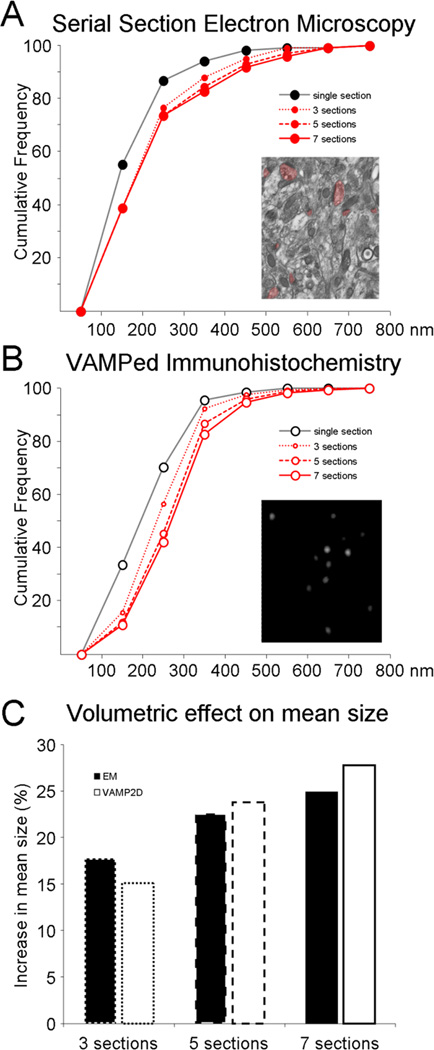
Figure 3. Comparison of size data obtained with EM versus vamping respectively.
The length of PSDs (nm) as measured by serial section EM (A) was compared to anti-PSD-95 puncta size using vamping (B) in the DG of the same animal. Cumulative distributions are plotted for size of synapses/puncta in single sections and when evaluated in 3, 5, or 7 consecutive images. C. The resulting increase in mean synapse size for EM (black bars) and punctum size for vamping (white bars) is plotted when using 3 sections (dotted line bars), 5 sections (dashed line bars), and 7 sections (solid line bars).

