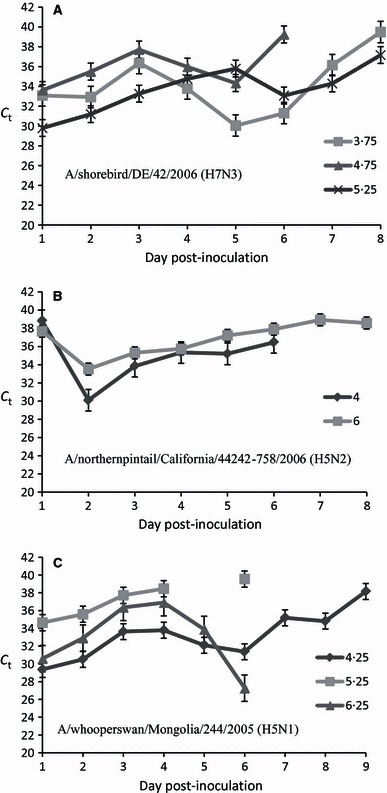
Figure 1.

Oral excretion of avian influenza virus RNA from experimentally inoculated ruddy turnstones. Cycle threshold (C t) values determined by H5 or H7 hemagglutinin‐specific RT‐PCR analyses for 8 or 9 days post‐inoculation (DPI). Each panel represents the mean C t values of infected birds inoculated with (A) low pathogenic avian influenza virus A/shorebird/DE/42/2006 (H7N3), (B) A/northernpintail/California/44242‐758/2006 (H5N2), or (C) highly pathogenic avian influenza virus A/whooperswan/Mongolia/244/2005 (H5N1). Error bars represent the standard deviation at each time point. The titers of virus are expressed as log10 EID50/100 μl.
