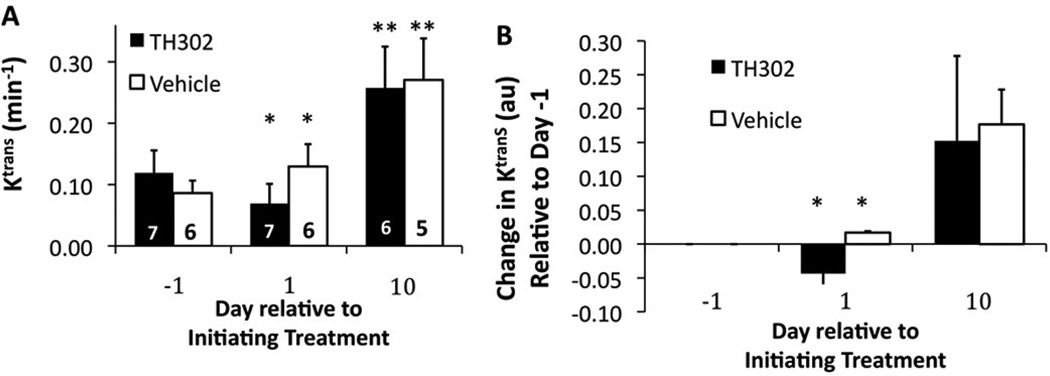
Figure 4. The effect of treatment on vascular permeability (Ktrans).
The average Ktrans of the tumor was measured with Dynamic Contrast Enhancement MRI. Error bars represent the standard deviation of cohorts of 5 to 7 mice. Statistically significant differences relative to the same cohort at Day -1 are indicated by asterisks (*, p< 0.05; **, p< 0.01). A) The median value of Ktrans and B) the relative changes in median Ktrans values showed that TH-302 caused a significant decrease in Ktrans relative to vehicle after one day of treatment, but not after eight days of treatment.

