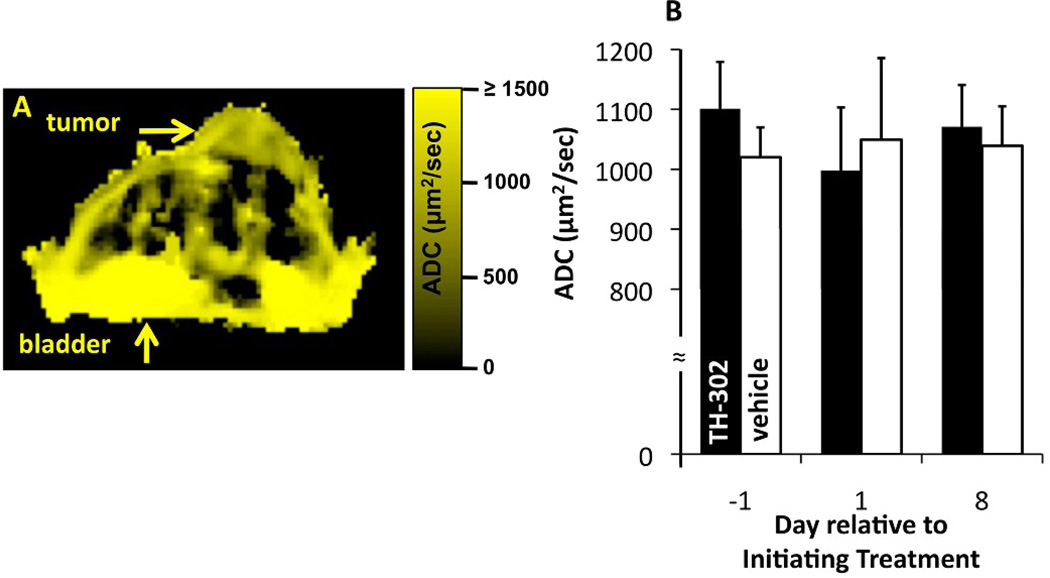
Figure 5.
The effect of TH-302 therapy on ADC measured with DW-MRI. A) The parametric map of ADC values showed good spatial homogeneity, especially relative to the torso. The anatomical image that corresponds to this ADC map is shown in Figure 2A. B) The median ADC did not change following TH-302 therapy. Error bars represent the standard deviation of each cohort. All median ADC values were statistically equivalent (p> 0.05).

