
Figure 3.
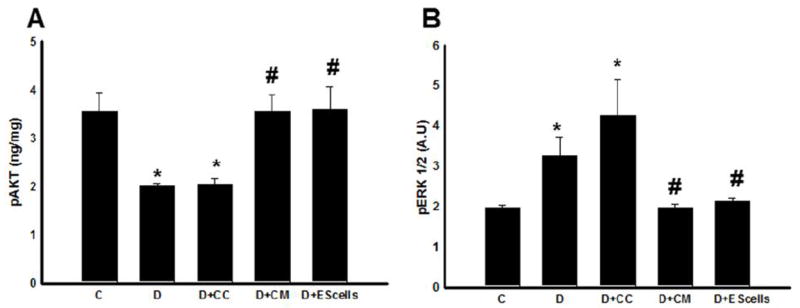
Phospho-Akt and extracellular signal regulated kinase (ERK) alterations following CM or ES cell transplantation in the DIC. (A) shows performed quantitative analysis of phospho-Akt regulation. (B) examines the quantitative levels of phosphorylated ERK up-regulation. *p<0.05 compared to C, and #p<0.05 vs D and D+CC. Data set are from heart homogenates of n=4-6 animals/group. A.U. = arbitrary units.