
Figure 4.
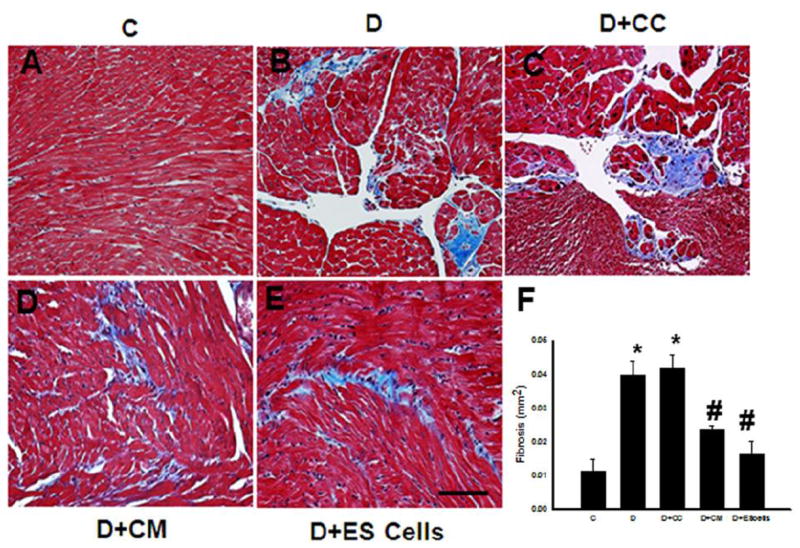
Effects of transplanted CM or ES cell on cardiac fibrosis. Photomicrographs show histological sections stained with Mason’s trichrome after 2 weeks of DOX treatment of different hearts from each group. Blue area shows extent of fibrosis in different conditions. Control, C (A), DOX, D (B), D+CC (C), D+CM (D) and D+ES cells (E). Scale bar = 50μm. (F) histogram shows quantitative cardiac fibrosis in post DIC with or without treatment groups. Data is from 6-8 animals. *p<0.05 compare to C, and #p<0.05 vs D and D+CC.