
Table 1.
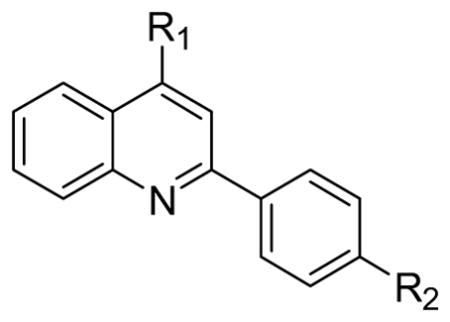
Structure-activity relationships for binding affinity at TDP-43 and stimulation of caspase-7 mediated cleavage of TDP-43.
| ||||||
|---|---|---|---|---|---|---|
| IC50 (μM)a TDP-43 binding | Stimulation of caspase-7 cleavage of TDP-43 (%)b | |||||
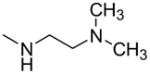
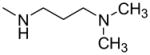
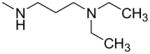
| C# | R1 | R2 | 10 μM | 3.2 μM | 1.0 μM | |
| 2 |
|
—OCH3 | 5.6 (2.7–11) | 123 ± 20 | 56 ± 22 | 10 ± 9 |
| 3 | —CH2CH3 | 20 (8.0–50) | 17 ± 5 | ND | ND | |
| 1 |
|
—OCH3 | 1.1 (0.55–2.2) | 117 ± 11 | 84 ± 24 | 15 ± 7 |
| 4 | —CH2CH3 | 3.3 (1.3–8.4) | 26 ± 8 | ND | ND | |
| 5 |
|
—OCH3 | 4.0 (2.1–7.6) | 124 ± 18 | 129 ± 24 | 14 ± 5 |
| 6 | —CH2CH3 | 7.6 (4.9–12) | 24 ± 9 | ND | ND | |
| 7 |
|
—OCH3 | 8.9 (5.4–15) | 4 ± 5 | ND | ND |
| 8 |
|
—OCH3 | 24 (7.8–74) | 9 ± 4 | ND | ND |
| 9 |
|
—H | >100 | c4 ± 2 | ND | ND |
a
IC50 values are the geometric mean and 95% confidence intervals of at least three determinations.
b
Values are the mean ± S.E.M. of three determinations and represent relative stimulation where 0% and 100% are equal to the intensity of CTF35 in the absence and presence of 10 μM T798, respectively.
c
Stimulation value at 32 μM compound.
ND. Not determined.