
Fig. 2.
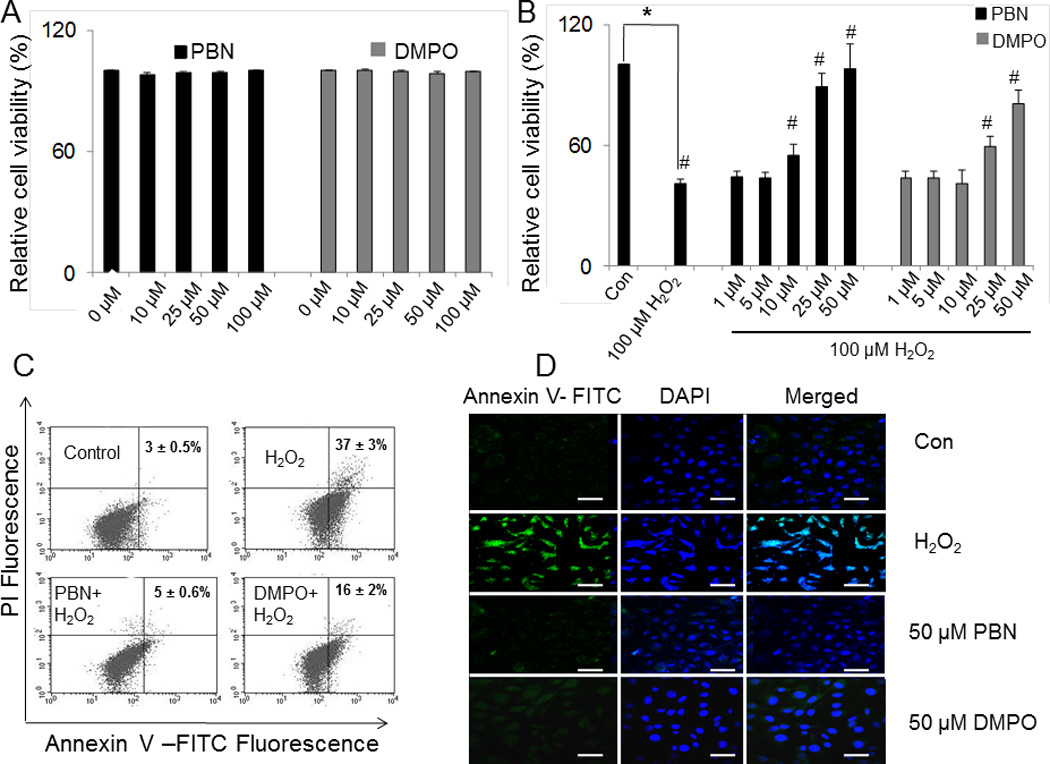
Effect of nitrones on H2O2-induced cytotoxicity and apoptosis in BAEC. (A) Cytotoxicity of nitrone (0–100 µM) alone determined by MTT assay. Data are represented as the mean ± SEM, where n = 6. (B) Cell viability of BAEC treated with H2O2 (100 µM) alone and those preincubated with nitrone (0–50 µM) as determined by MTT assay. Data are represented as the mean ± SEM, *p < 0.05 vs. control (untreated cells), and #p < 0.05 vs. H2O2-treated cells, where n = 6. (C) Induction of apoptosis in H2O2-treated BAEC and subsequent inhibition by nitrone-pretreatment. Apoptotic cells were analyzed flow cytometrically, and a dot plot representation of Annexin-V-FITC-fluorescence (x-axis) vs. PI-fluorescence (y-axis) has been displayed. The figure represents the best of three independent experiments. (D) Immunofluorescence study of Annexin V-FITC positive apoptotic cells treated with H2O2 (100 µM) alone for 24 h and those preincubated with nitrone (0–50 µM). The right panel corresponds to the merged image of FITC-fluorescence and DAPI-fluorescence, used to stain the nuclei. Bar represents 10 µm.