
Fig. 3.
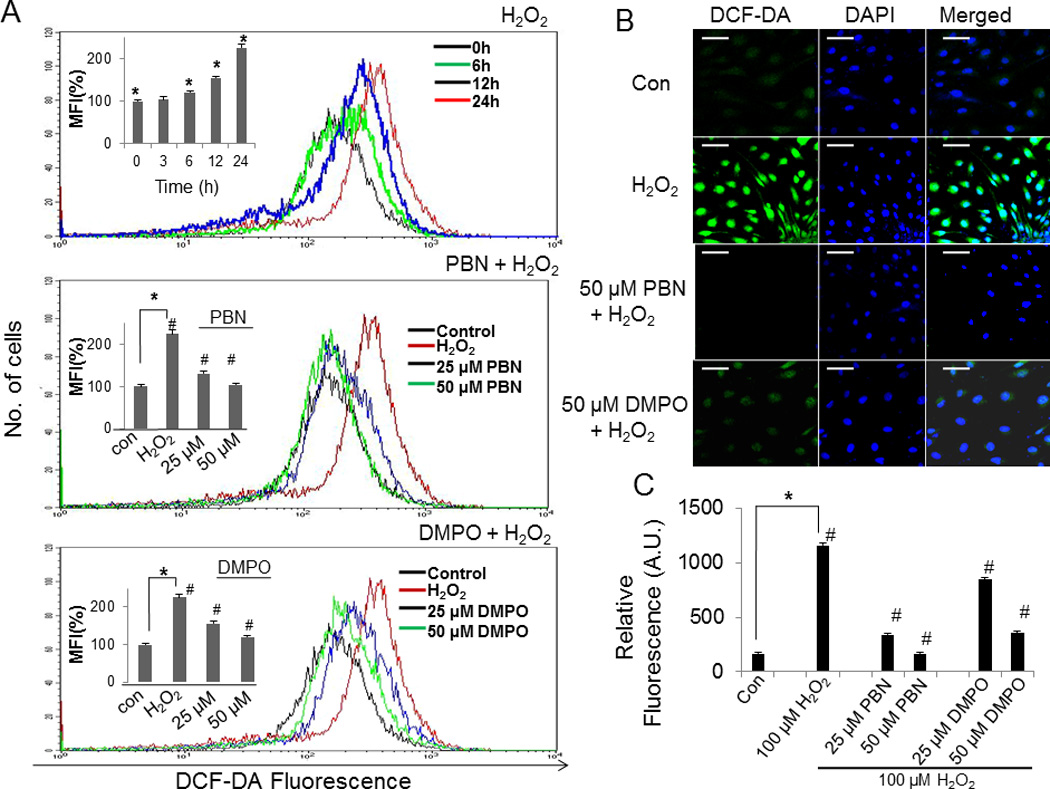
Effect of nitrones on H2O2-induced ROS generation in BAEC. (A) BAEC were treated with 100 µM H2O2 alone at various time points (0–24 h) in the absence or presence of nitrone (0–50 µM). After treatment, cells were incubated with 25 µM of DCFH-DA at 37 °C for 30 min in the absence of light and ROS generation was then assessed using a FACS Calibur flow cytometer (BD) with excitation at 488 and emission at 535 nm. (Inset), Mean fluorescence intensity (MFI) form the histogram analysis of all three sets such as H2O2-alone (various time intervals), PBN + H2O2 and DMPO + H2O2 were presented as mean ± SEM, *p < 0.05 vs. control (untreated cells), and #p < 0.05 vs. H2O2-treated cells, where n = 3. (B) Confocal images of BAEC treated with H2O2 (100 µM) alone and those preincubated with nitrone (0–50 µM). The right panel corresponds to the merged image of DCF-fluorescence and DAPI-fluorescence, bar represents 10 µm. (C) A plot of relative DCF- fluorescence obtained from the average of 100 cells. Data are represented as the mean ± SEM, *p < 0.05 vs. control (H2O2-untreated cells), and #p < 0.05 vs. H2O2-treated cells, where n = 3.