
Fig. 4.
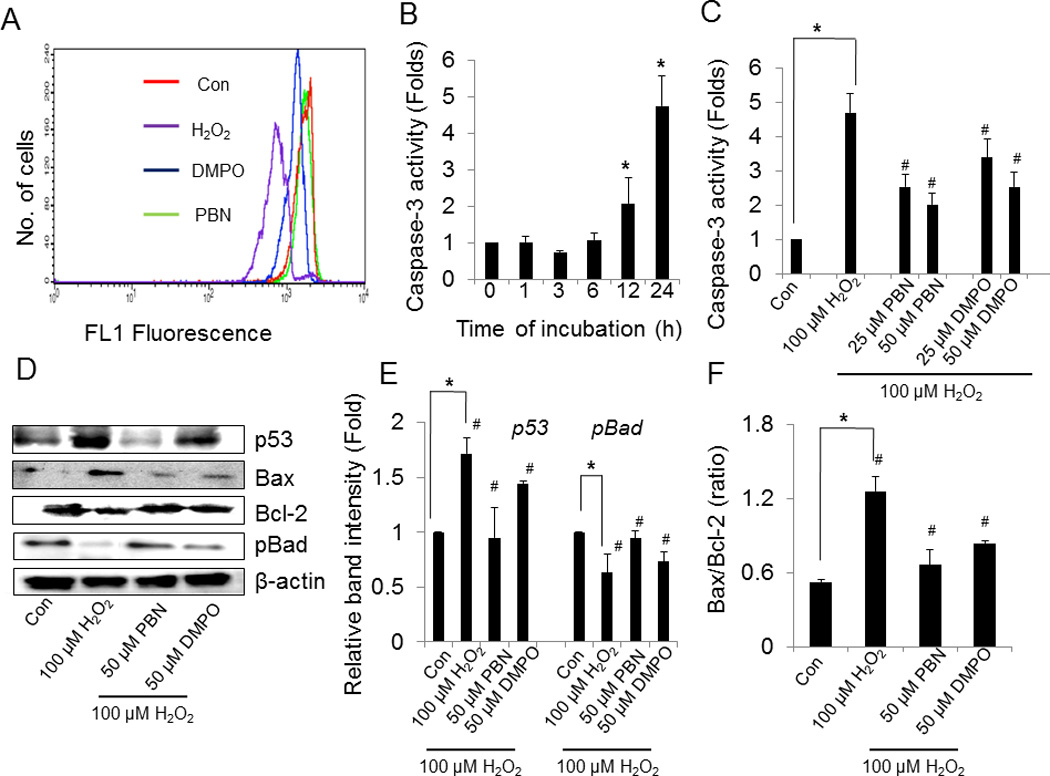
Effect of nitrones on H2O2-induced mitochondrial dysfunction, caspase-3 activation and modulation of pro- and anti-apoptotic proteins in BAEC. (A) Determination of mitochondrial membrane potential (MMP). BAEC were treated with 100 µM H2O2 in the absence or presence of nitrone (0–50 µM) for 24 h. After treatment cells were stained with rhodamine 123 and incubated for 60 min, and MMP was measured using a FACS Calibur flow cytometer (BD) with excitation at 488 and emission at 535 nm. Results are expressed as a representative histogram analysis. (B) Time-dependent activation of caspase-3 by H2O2. To determine time-dependent activation of caspase-3 by H2O2, BAEC were treated with 100 µM H2O2 at various time points (0–24 h) and caspase-3 activity was determined by using the 7-amino-4-trifluoromethyl coumarin assay (AFC) linked to the tetrapeptide DEVD as described in “materials and methods” section. Results are represented as mean ± SEM, *p < 0.05 vs. control (untreated cells). (C) Inhibition of H2O2-induced caspase-3 activation by nitrones. To determine nitrone-induced inhibition of caspase-3 activity, BAEC were preincubated with nitrone (0–50 µM) and then treated with 100 µM H2O2 for 24 h. After treatment cells were incubated with DEVD-AFC. Finally the release of free AFC was monitored using Cytofluor 4000 fluorimeter (excitation, 400 nm; emission, 508 nm). Results are represented as mean ± SEM, *p < 0.05 vs. control (untreated cells), and #p < 0.05 vs. H2O2-treated cells, where n = 3. (D) Modulation of pro-and anti-apoptotic proteins by the nitrones in H2O2-treated BAEC. Expression levels of p53, Bax, Bcl-2 and p-Bad in BAEC treated with H2O2 in the absence and presence of nitrone were monitored by western blotting. (E), (F) Densitometric analysis of the expressions of p53, p-Bad and Bax/ Bcl-2 ratio. Results are represented as mean ± SEM, *p < 0.05 vs. control (untreated cells), and #p < 0.05 vs. H2O2-treated cells, where n = 3.