
Figure 5.
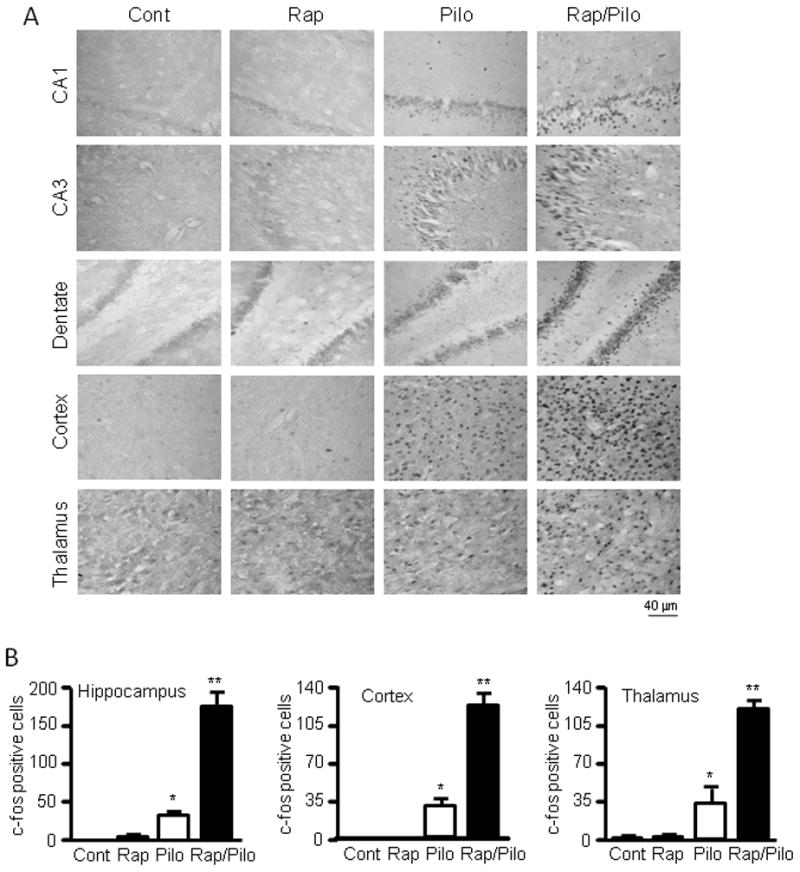
Rapamycin increases c-fos staining in the hippocampus, cortex and thalamus by pilocarpine. (A) Representative images (magnification 25×) of c-fos staining in CA1, CA3, dentate gyrus (DG), cortex and thalamus in immature rats treated with vehicle (Cont) or rapamycin (Rap) with or without pilocarpine (pilo). (B) Quantification of c-fos expression. The number of identifiable individual cells with c-fos positive staining is 0 ± 0 for the control, 0.5 ± 0.5 for rapamycin, 31.8 ± 4.4 for pilocarpine alone, and 173.7 ± 17.8 for both rapamycin and pilocarpine in the hippocampus; 0 ± 0 for the control, 0 ± 0 for rapamycin, 30.5 ± 6.7 for pilocarpine alone, and 124.8 ± 10.1 for both rapamycin and pilocarpine in the cortex; 0.5 ± 0.5 for the control, 1.0 ± 1.0 for rapamycin, 36.0 ± 13.2 for pilocarpine alone, and 118.3 ± 8.4 for both rapamycin and pilocarpine in the thalamus. * indicates significant increase of c-fos expression in the pilocarpine group compared to the control or rapamycin groups (p<0.05) and ** indicates significant difference between the group treated with both rapamycin and pilocarpine versus groups treated with vehicle, rapamycin or pilocarpine (p<0.05). (mean ± SEM; n=5; ANOVA with Tukey post hoc adjustment).