
Figure 6.

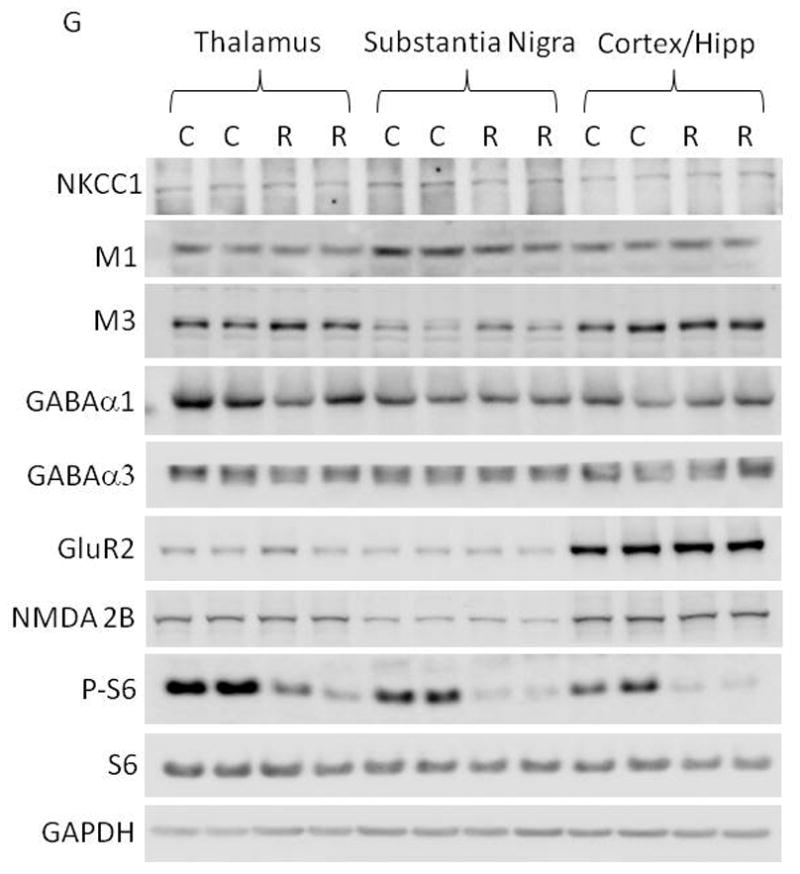
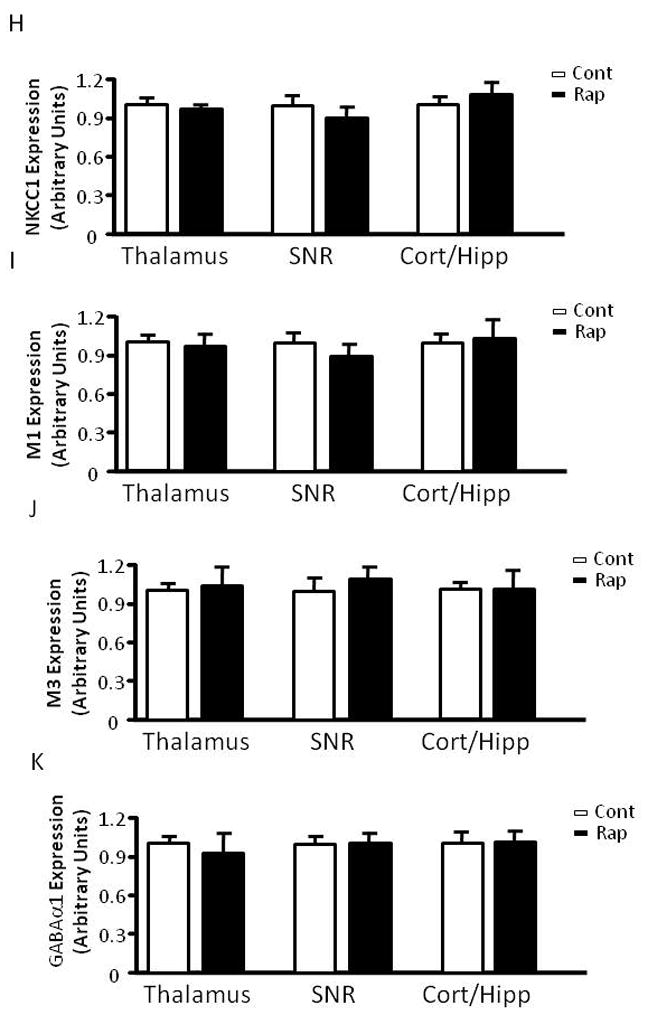
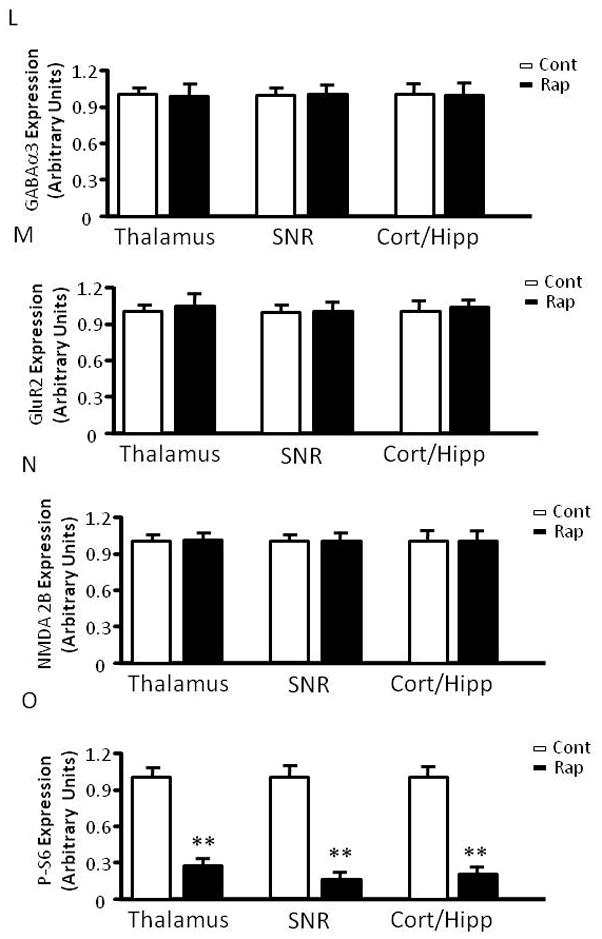

Rapamycin treatment reduces KCC2 levels in the hippocampus and thalamus of immature rats. (A) Immunoblot of KCC2 and GAPDH after vehicle or rapamycin treatment in tissues from the hippocampus (Hip), thalamus, (Thal), cortex (Ctx), SNR and GP/CP. (B–F) Quantification of KCC2 expression in the hippocampus, thalamus, cortex, SNR and GP/CP of control and rapamycin-treated rats (Hip: 1.000 ± 0.04023 vs 0.8560 ± 0.04201; Thal: 1.000 ± 0.04964 vs 0.7506 ± 0.04873; Cortex: 1.000 ± 0.05097 vs 1.021 ± 0.05772; SNR: 1.000 ± 0.04115 vs 1.062 ± 0.1345;GP/CP:1.000 ± 0.1543 vs 1.0858 ± 0.2158). (mean ± SEM; n=10–14; t-test, * indicates p<0.05, ** indicates p<0.01). (G) Immunoblot of NKCC1, S6, phosphorylated S6 (P-S6), M1, M3, GABAα1, GABAα3, GluR2, NMDA2B and GAPDH after 3 days of vehicle (C) or rapamycin treatment (R). Brain tissues were harvested, including thalamus, SNR, hippocampus (Hipp) and cortex. (H–O) Quantification of NKCC1, M1, M3, GABAα1, GABAα3, GluR2, NMDA2B and phosphorylated S6 (P-S6) expression in thalamus, SNR, hippocampus (Hipp) and cortex. (H)NKCC1 expression (Thal:1.000 ± 0.1436 vs. 0.9324 ± 0.1023; SNR: 1.000 ± 0.1523 vs 0.8960 ± 0.2306; Cort/Hipp: 1.000 ± 0.1478 vs 1.1432 ± 0.2480). (I) M1 expression (Thal:1.000 ± 0.1212 vs 0.9422 ± 0.1112; SNR: 1.000 ± 0.1323 vs 0.8882 ± 0.2431; Cort/Hipp: 1.000 ± 0.1231 vs 1.1202 ± 0.3510). (J) M3 expression (Thal:1.000 ± 0.1212 vs 0.9422 ± 0.1112; SNR: 1.000 ± 0.1323 vs 0.8882 ± 0.2431; Cort/Hipp: 1.000 ± 0.1231 vs. 1.1202 ± 0.3510). (K) GABAα1 expression (Thal: 1.000 ± 0.1145 vs 0.8422 ± 0.3203; SNR: 1.000 ± 0.1108 vs 1.0342 ± 0.1486; Cort/Hipp: 1.000 ± 0.2135 vs 1.1076 ± 0.1265). (L) GABAα3 expression (Thal: 1.000 ± 0.1124 vs 0.9812 ± 0.2406; SNR: 1.000 ± 0.1043 vs 1.0302 ± 0.1124; Cort/Hipp: 1.000 ± 0.2123 vs 1.0086 ± 0.2225). (M) GluR2 expression (Thal: 1.000 ± 0.1123 vs 1.2812 ± 0.2516; SNR: 1.000 ± 0.1231 vs 1.0412 ± 0.1143; Cort/Hipp: 1.000 ± 0.2013 vs 1.2014 ± 0.1215). (N) NMDA2B expression (Thal: 1.000 ± 0.1134 vs. 1.1342 ± 0.1506; SNR: 1.000 ± 0.1112 vs 1.0310 ± 0.1087; Cort/Hipp: 1.000 ± 0.2103 vs 1.0214 ± 0.1335). (O) phosphorylated S6 (P-S6) expression. (Thal: 1.000 ± 0.1309 vs 0.2627 ± 0.0328; SNR: 1.000 ± 0.1095 vs 0.1631 ± 0.0043; Cort/Hipp: 1.000 ± 0.1296 vs 0.2031 ± 0.0165). (mean ± SEM; n=10–14; t-test, * indicates p<0.05, ** indicates p<0.01). (P) Rapamycin does not change KCC2 levels in the thalamus, SNR, cortex and hippocampus of mature rats. Immunoblot of KCC2 and GAPDH after vehicle or rapamycin treatment for three days in tissues from the thalamus, SNR, cortex and hippocampus. (Q) Quantification of KCC2 expression in the thalamus, SNR, cortex and hippocampus of control and rapamycin-treated mature rats. (Thalamus: 1.000 ± 0.1147 vs 1.0526 ± 0.0722; SNR: 1.000 ± 0.0768 vs 1.1332 ± 0.0893; Cortex: 1.000 ± 0.0284 vs 0.9025 ± 0.0424; Hippocampus: 1.000 ± 0.0193 vs 1.0842 ± 0.0513). (mean ± SEM; n=10–14).