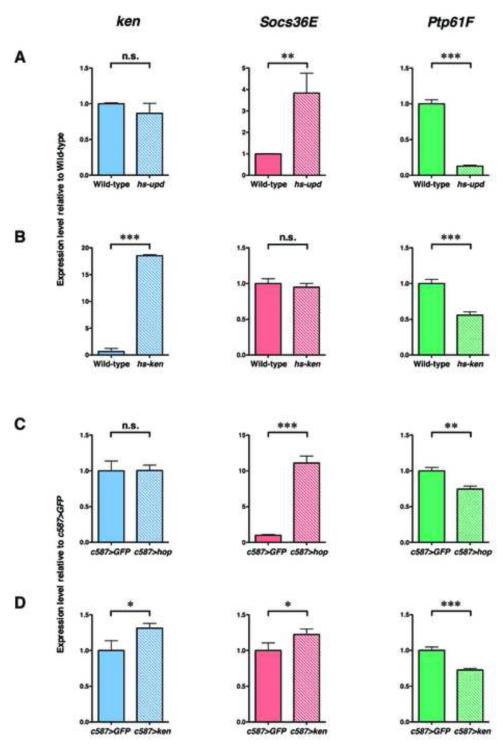
Figure 6. Stat92E and Ken both negatively regulate Ptp61F expression.
(A) Quantitative RT-PCR analysis of ken, Socs36E, and Ptp61F transcript levels in wild-type and heat-shocked hs-upd testes. (A, left) ken expression does not appreciably change in response to ectopic JAK-STAT pathway activation. (A, middle) Socs36E expression levels increase 5-fold in response to ectopic JAK-STAT signaling. (A, right) Ptp61F levels significantly decrease due to JAK-STAT pathway activation. (B) qPCR analysis of ken, Socs36E, and Ptp61F transcript levels in wild-type and heat-shocked hs-ken (ken misexpressing) testes. (B, left) A single heat-shock pulse significantly upregulates ken in hs-ken testes. (B, middle) Socs36E expression is not influenced by ectopic ken expression. (B, right) Ken negatively regulates Ptp61F expression levels. For comparison, expression levels of each gene were normalized to wild-type (set to 1). (A) qPCR analysis of ken, Socs36E, and Ptp61F transcript levels in c587>GFP and c587>hopTumL testes from flies that have been shifted to 31°C for one week. (C, left) ken expression does not appreciably change in response to ectopic JAK-STAT pathway activation. (C, middle) Socs36E expression levels increase more than 10-fold in response to ectopic JAK-STAT signaling. (C, right) Ptp61F expression significantly decreases in response to JAK-STAT pathway activation. (D) qPCR analysis of ken, Socs36E, and Ptp61F transcript levels in c587>GFP and c587>ken testes. (D, left) Shifting c587>ken flies to 31°C for one week causes a significant increase in ken expression. (D, middle) Socs36E expression is not influenced by ectopic ken expression. (D, right) Ken negatively regulates Ptp61F expression levels specifically in the CySC lineage. For comparison, expression levels of each gene were normalized to c587>GFP controls (set to 1). Error bars represent standard deviations of the mean. n.s., not significant; **, P < 0.01; ***, P < 0.001 (Student’s t test).

