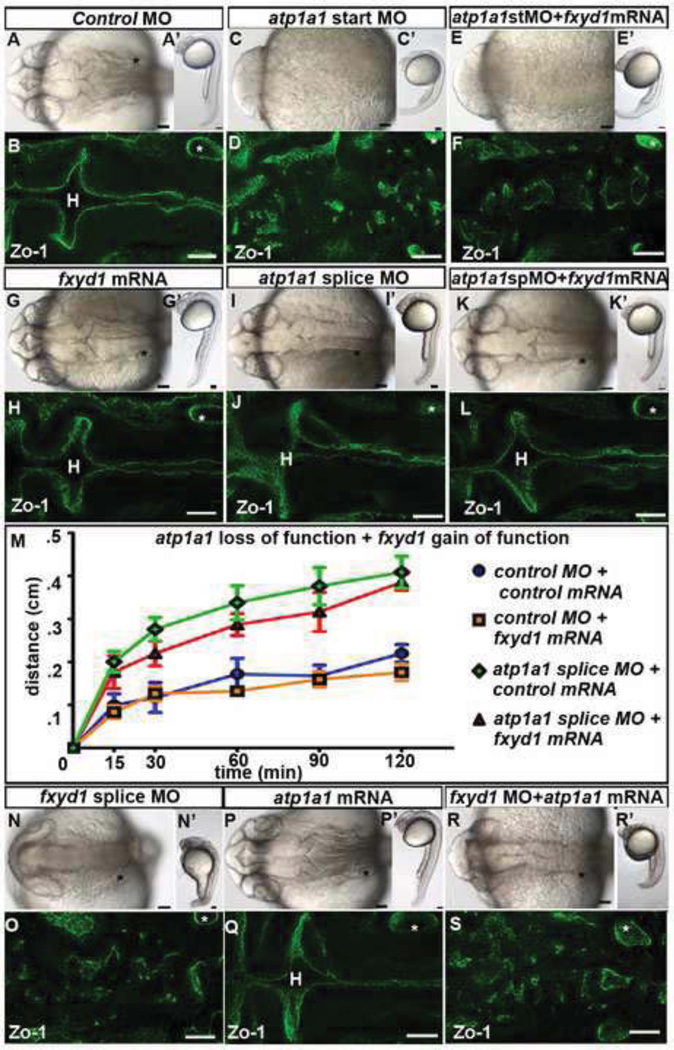
Fig. 5. Atp1a1 and Fxyd1 do not substitute for one another.
(A–L) Overexpression of fxyd1 in atp1a1 loss of function embryos. Control (A–B), atp1a1 site start MO (C–D), atp1a1 start site MO + fxyd1 mRNA (E–F), fxyd1 mRNA (G–H), atp1a1 splice site MO (I–J), and fxyd1 mRNA + atp1a1 splice site MO (K–L). (M) Neuroepithelial permeability in control MO (blue), fxyd1 gain of function (orange), atp1a1 splice site MO (red), and fxyd1 mRNA + atp1a1 splice site MO (green). Data represented as mean +/− SEM, p>.05. (N–S) fxyd1 MO (N–O), atp1a1 mRNA (P–Q), and atp1a1 mRNA+ fxyd1 MO (R–S). Brightfield dorsal (A–R) and lateral (A’–R’) views. Zo-1 junction staining (B,D,F,H,J,L,O,Q,S). All images taken at 24 hpf with anterior to left. Asterisk = ear. H = hindbrain. Scale bars = 50µm.

