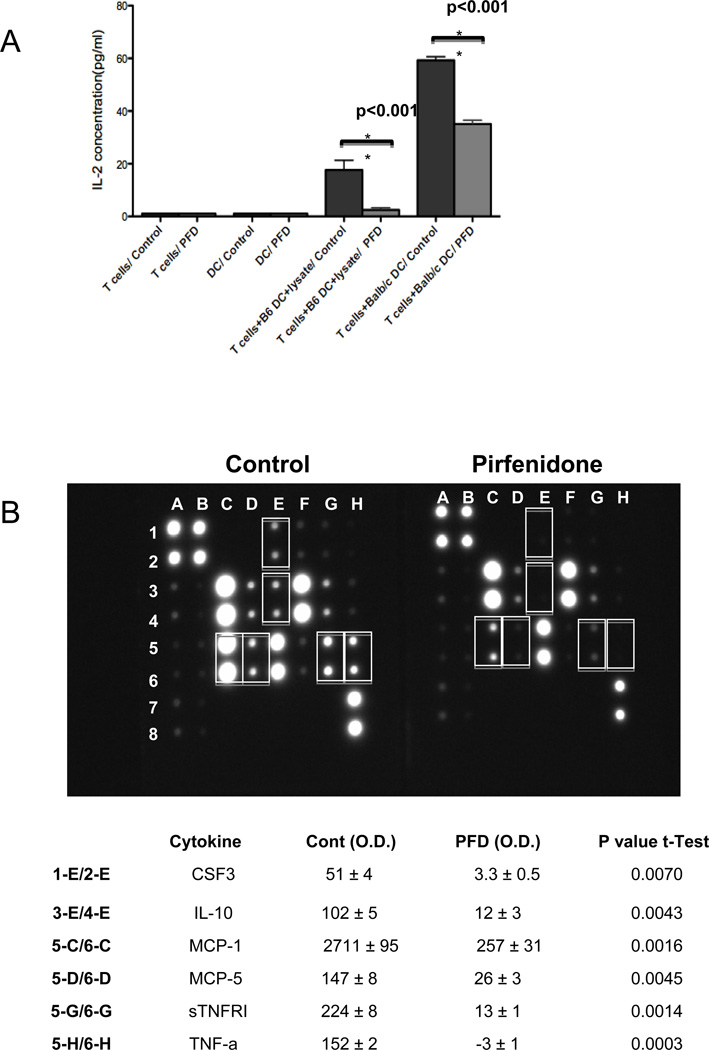
Figure 4.
A. PFD inhibits DC direct and indirect T cell activation
To determine the response of PFD to the indirect pathway, C57BL/6 +/− PFD pretreated DCs were incubated with BALB/c splenocyte lysate (1:5 ratio) and previously stimulated CD3+ T cells (1:1 ratio). For the direct pathway, BALB/c +/− PFD pretreated DCs were incubated with previously stimulated C57BL/6 alloreactive CD3+ T cells. The DC-T cell co-cultures were without PFD so PFD had no direct effect upon T cells. Cell supernatant was collected 24 hours after stimulation and evaluated for T cell activation based on IL-2 secretion as measured by ELISA (pg/ml). There is a significant decrease in IL-2 expression of T cells that were stimulated with PFD treated C57BL/6 and BALB/c DCs thereby demonstrating indirect and direct pathways inhibition. The graph illustrates the mean +/− SEM (n = 4–6 per group) of IL-2 from unstimulated T cells +/− PFD and stimulated (T cells + DC + lysate) +/− PFD.
B. PFD inhibits stimulated DC cytokine secretion
Isolated DCs were treated with or without 2mM PFD for 72 hours and stimulated with 1µg/ml LPS for 24 hours. The supernatant was collected and cytokines measured based on mouse multiple cytokine array panel and relative cytokine value assessed by densitometry for each individual cytokine spot. Represented is an example of one of the multiple cytokine array panels. Densitometry analysis of the PFD inhibited cytokines is presented in the table and is based on three independent experiments showing the mean +/− SEM and p value based on individual t-tests.

