
Figure 3.
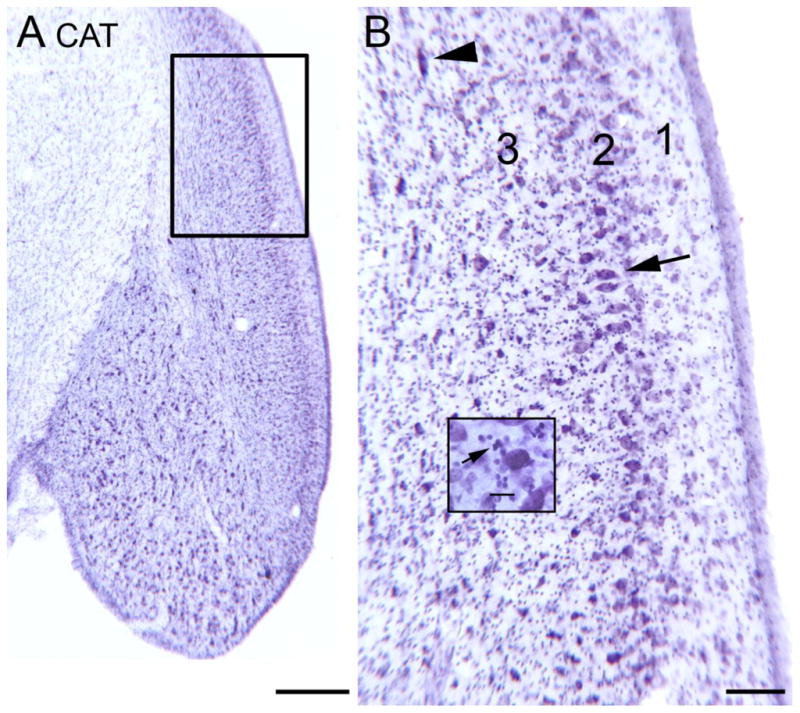
The DCN in the cat shown on a CV-stained section. A. Low magnification image; note the laminar appearance. The rectangle shows the area in the larger image in B. Scale bar = 500 μm B. Laminar organization of cat DCN. There is much lighter staining in the outer or molecular layer (1). The arrow indicates a group of neurons in the fusiform/pyramidal cell layer (2) with elongated cell bodies oriented perpendicular to the surface. The arrowhead shows a cell in the polymorphic (3) layer with an elongated cell body. Scale bar =100 μm. The inset shows small, darkly labeled profiles, at arrow. Scale bar in inset = 0 μm.