
Figure 4.
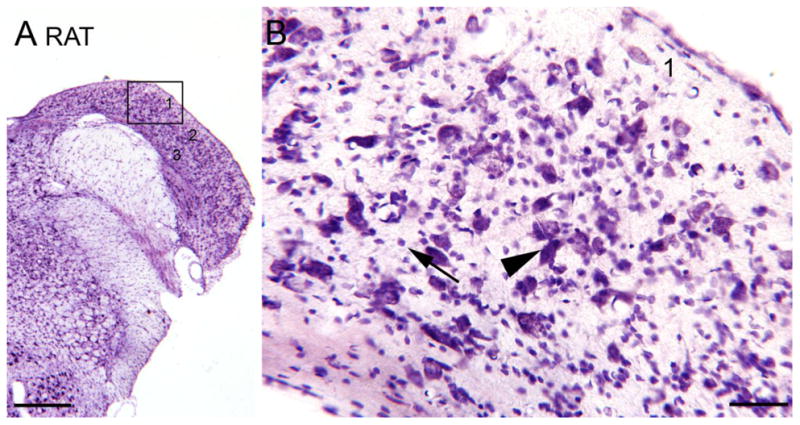
The DCN in the rat, CV staining. A. Low magnification image. The rectangle shows the location of the higher magnification image in B. Scale bar = 500 μm. B. 1, 2, 3, indicate the layers. The arrowhead shows a large cell with fusiform cell body oriented perpendicular to the surface. The arrow shows small neurons.