
Figure 3. Immunocytochemistry for sEH in neuronal cultures.
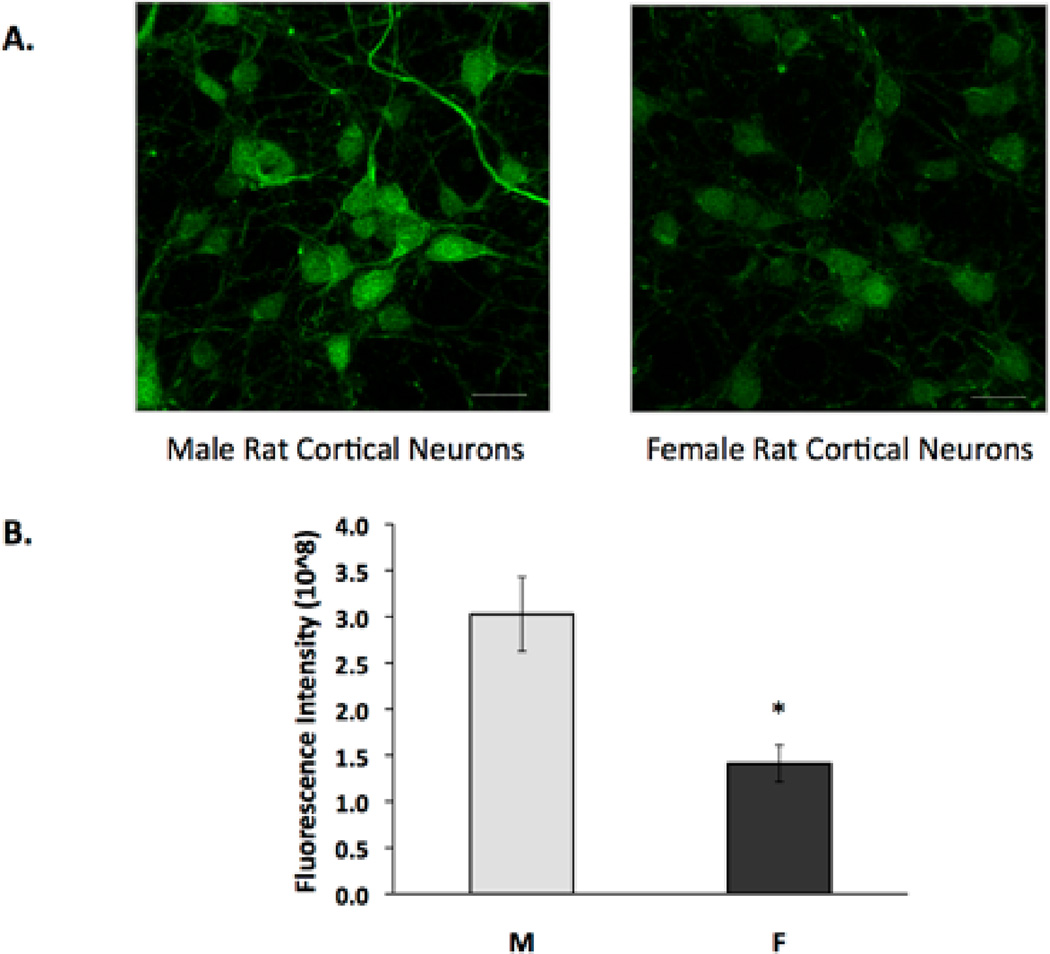
Cultured cortical neurons were immunolabeled for sEH, and images were obtained using confocal microscopy. All images were captured at identical time points with neurons cultured from the same litter and plated at equal densities. Microscope settings were identical for all imaged cells. (A) sEH is broadly expressed in cortical neurons as seen in representative confocal images. Scale bar, 20 µm. (B) The bar graph represents average total fluorescent intensity minus background intensity in neurons from males (M) and females (F). (n=4, *p=0.011) Images are representative of at least four biological replicates.