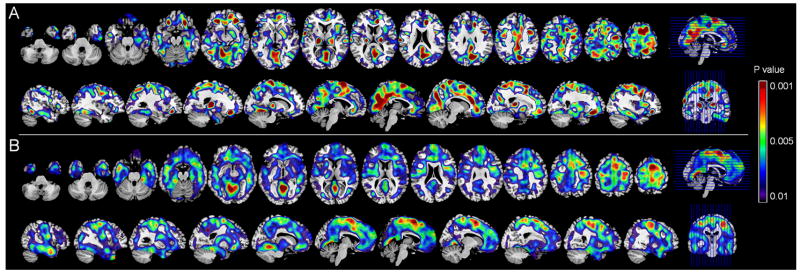
Figure 2. Brain glucose metabolism as a function of family history of LOAD.
Statistical parametric maps (SPMs) showing reduced metabolism in:
A. NL MH compared to NH
B. NL MH compared to PH
Controlling for age, gender, education and ApoE status. Areas of reduced metabolism are represented on a blue-to-yellow color-coded scale, reflecting P values between 0.01–0.001, as indicated on the right side of figure. SPMs are displayed onto the axial and sagittal views of a standard, spatially normalized MRI.

