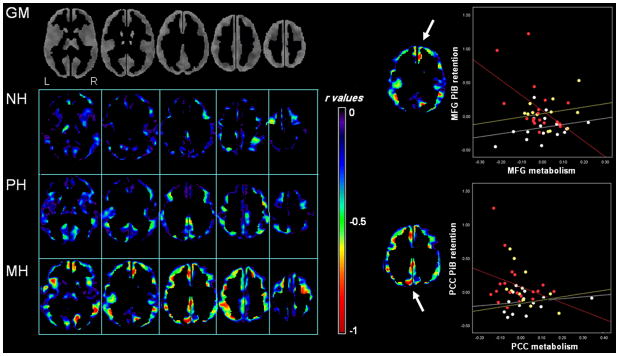
Figure 3. Voxel-wise inter-correlations between PiB retention and glucose metabolism.
Left side of figure: Statistical parametric maps showing voxel-wise correlations between PiB retention and metabolism in NH (top row), PH (middle row), and MH (bottom row). For illustrative purposes, results are shown with r values range 0 to −1, to highlight the shift towards more negative correlations across modality in MH compared to NH and PH. Maps are displayed onto the axial view in the standardized template space, ranging from more inferior to more superior brain slices. Analysis of PET data was restricted to gray matter (GM) voxels, as shown in the first row.
Right side of figure: Scatterplots showing correlations between PiB and FDG measures at the peak of maximum significance for medial frontal gyrus (MFG) and posterior cingulate cortex (PCC) of MH (red), PH (yellow) and NH (white). Only NL MH showed significant relationships between variables (MFG: R2=0.33, PCC: R2=0.23, P<0.05).

