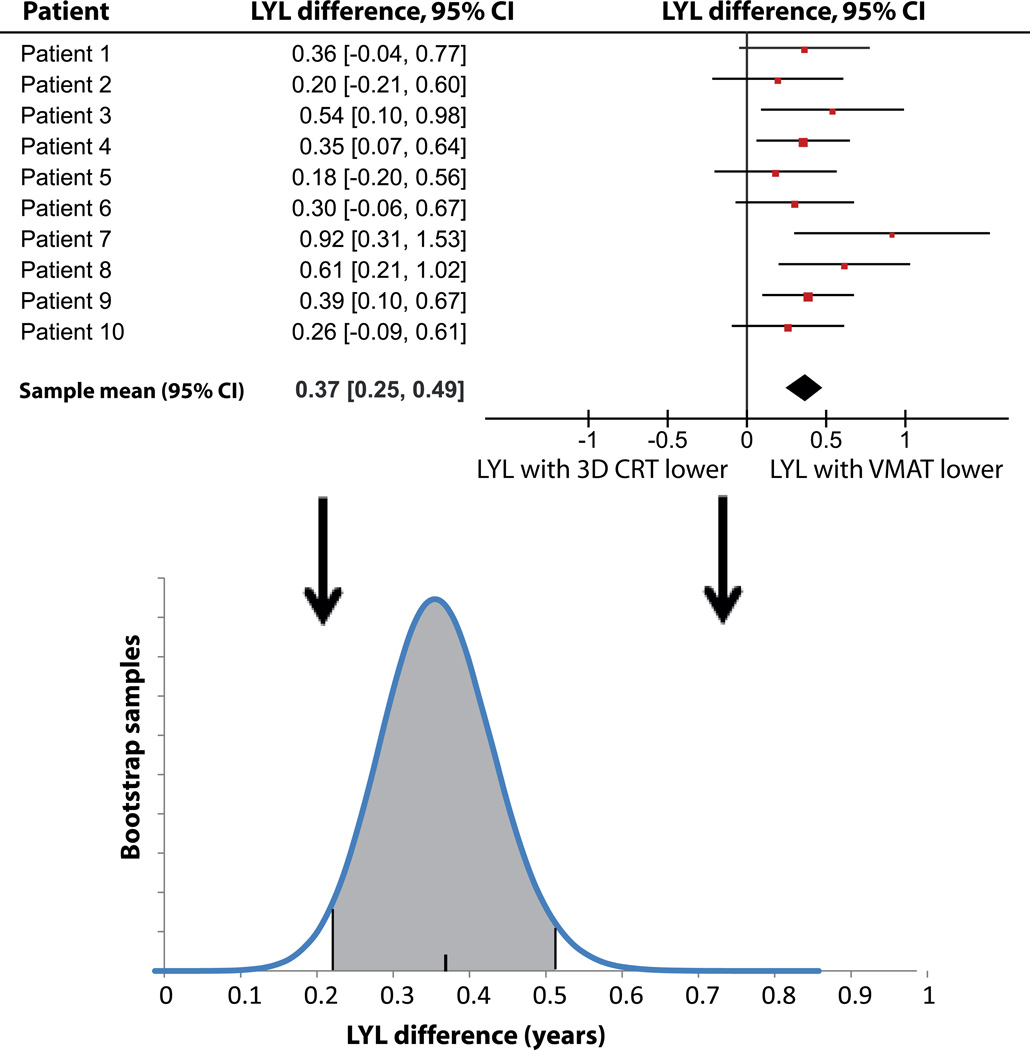
Figure 5.
Results of the statistical analysis for the 3D CRT - VMAT LYL difference. The mean differences with corresponding 95% confidence intervals (CI) for each patient from the Monte Carlo sampling are shown, as well as the resulting distribution of difference estimates obtained from the bootstrapping, with the final estimates of mean and 95% CI.

