
Figure 2.
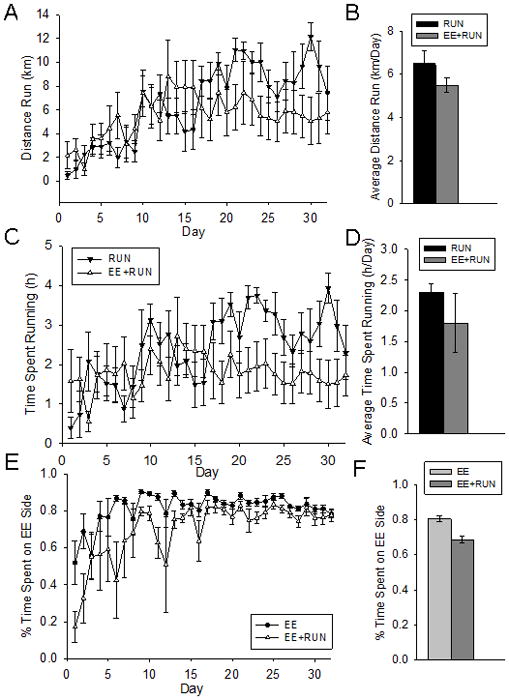
Wheel running and duration spent on the EE side. A) Average distance run on wheels (km) per day in the RUN and EE+RUN groups. B) Average distance run on wheels (km/day) collapsed across the entire 32 day period in the RUN and EE+RUN groups. C) Average time spent running on wheels (h) per day in the RUN and EE+RUN groups. D) Average time spent running on wheels (h/day) collapsed across the entire 32 day period in the RUN and EE+RUN groups. E) Average percent time spent on the EE side per day in the EE and EE+RUN groups. F) Average percent time spent on the EE side collapsed across the entire 32 day period in the EE and EE+RUN groups. Standard error bars shown.