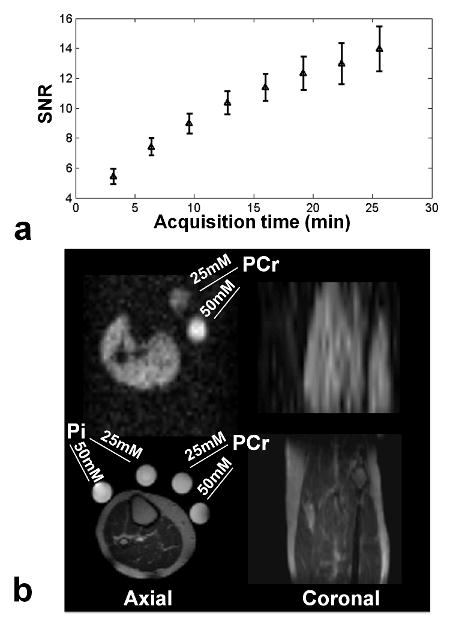
Fig. 4.

a) Mean and standard deviation of the SNR as a function of acquisition time (i.e number of averages) for all the five volunteers. b) Example of axial (left) and coronal slices (right) of a volunteer acquired in 25 min (eight averages). The PCr images have been bilinearly interpolated to match the matrix size of the 1H image for visualization purposes.
