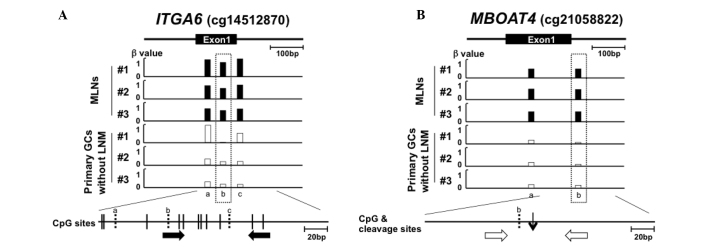
Figure 1.
Representative genomic regions around the CpG sites differentially methylated between metastatic lymph nodes and GCs without LNM and primer design in the regions. Below the genomic structure of a region, β values (methylation levels) of the CpG sites carried by Infinium bead array are shown. The differentially methylated CpG site is marked by a rectangle with dotted line. A CpG map is drawn at the bottom, vertical lines (solid and broken lines) indicate CpG sites and broken lines indicate CpG sites whose β values were measured. (A) A region whose methylation level was assessed by qMSP. Primers specific to the methylated sequence (closed arrows) were designed on CpG sites around the differentially methylated sites based on the bisulfite-modified sequence. (B) A region whose methylation level was assessed by qPTMR. Primers (open arrows) were designed to amplify the region encompassing the MspJI-cleaved site (thin vertical arrow) based on the unmodified sequence. GC, gastric cancer; MLN, metastatic lymph nodes; LNM, lymph node metastases; qMSP, quantitative methylation-specific PCR; qPTMR, quantitative PCR following treatment with a methylation-dependent restriction enzyme.

