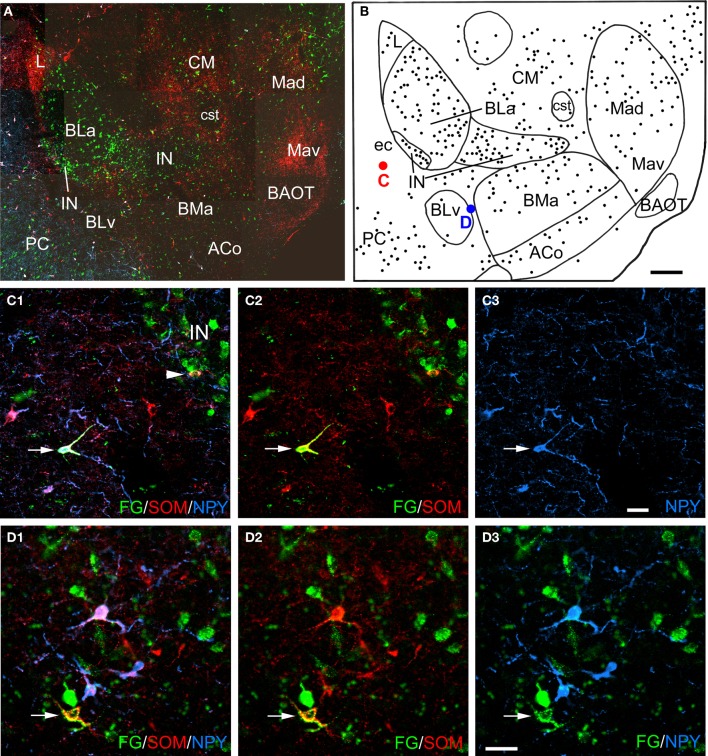
Figure 2.
(A) Low power photomontage of a coronal section through the rostral amygdala (Bregma −2.1) in case R7 that was triple-labeled for FG (green), SOM (red), and NPY (blue). Lateral is left. After this section was analyzed the coverslip was removed and the section was counterstained with pyronin Y. This allowed the nuclear borders to be more precisely defined, as depicted in B. (B) Drawing of the distribution of FG-labeled neurons seen in A, created by overlaying a plot of FG-labeled neurons in this section over a drawing of the nuclei identified after counterstaining. The positions of a triple-labeled FG/SOM/NPY+ neuron in the external capsule (ec, red dot), and a FG/SOM+ neuron located between the ventral basolateral nucleus (BLv) and the anterior basomedial nucleus (BMa) that was NPY-negative (blue dot) are indicated. (C1–C3) Photomicrographs of the FG/SOM/NPY+ neuron shown in red in B (arrow). Also note a FG/SOM+ neuron (yellow) that was NPY-negative at the lateral edge of the lateral intercalated nucleus (IN; arrowhead in C1). (C1) Merged image visualizing all three channels. (C2) Image with the blue channel omitted, showing that the neuron exhibited colocalization of FG and SOM (yellow). (C3) Image with only the blue channel, showing that the neuron was also NPY+ (blue). (D1–D3) Photomicrographs of the FG/SOM+ neuron shown in blue in B (arrow). (D1) Merged image visualizing all three channels. (D2) Image with the blue channel deleted, showing that the neuron exhibited colocalization of FG and SOM (yellow). (D3) Image with the red channel deleted, showing that the neuron was NPY-negative. Also note that the three blue NPY neurons located above the FG/SOM+ neuron colocalize SOM (see D1 and D2). Additional abbreviations: ACo, anterior cortical nucleus; BAOT, bed nucleus of the accessory olfactory tract; BLa, anterior basolateral nucleus; CM, medial central nucleus; cst, commissural stria terminalis; L, lateral nucleus; Mad, anterodorsal medial nucleus; Mav, anteroventral medial nucleus; PC, piriform cortex. Scale bars = 300 μ m in B (also applies to A), 40 μ m in C and D.

