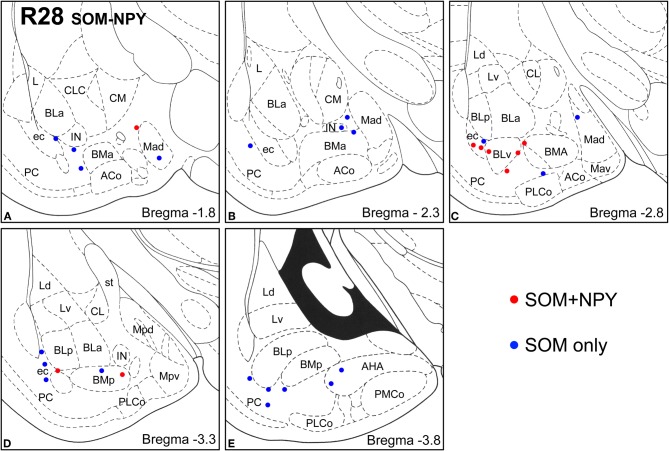
Figure 6.
Sections arranged from rostral (A) to caudal (E) depicting the locations of long-range non-pyramidal neurons in the amygdalar region expressing SOM and NPY in case R28. Each dot represents one neuron. Red dots are FG+ neurons expressing SOM and NPY. Blue dots are FG+ neurons expressing SOM, but not NPY. Templates are modified from the atlas by Paxinos and Watson (1997).

