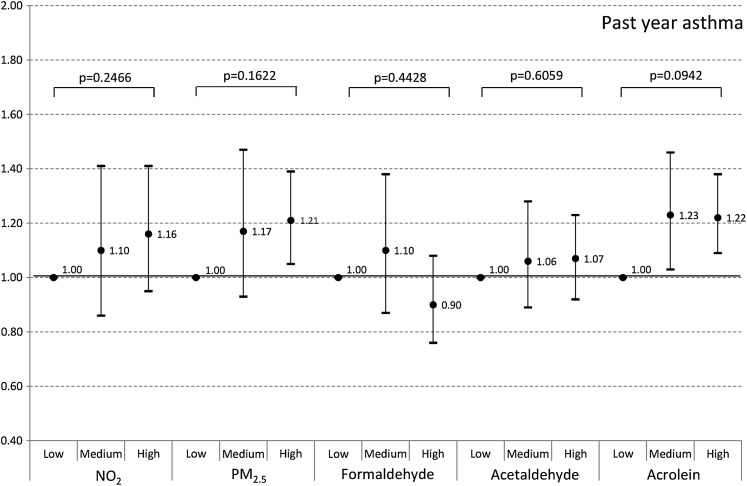
Figure 4.
Relationships between air pollutants in classrooms and past year asthma in the entire sample population of schoolchildren (N=6590) of the 6 Cities Study. Tertiles are defined according to the distribution of air pollutants in the classrooms (in μg/m3). Nitrogen dioxide (NO2): low ≤23.7, medium >23.7 to ≤31.6, high >31.6; fine particles with aerodynamic diameter ≤2.5 μm (PM2.5): low ≤12.2, medium >12.2 to ≤17.5, high >17.5; formaldehyde: low ≤19.1, medium >19.1 to ≤28.4, high >28.4; acetaldehyde: low ≤6.5, medium >6.5 to ≤9.9, high >9.9; acrolein: low=limit of detection (LD), medium >LD to ≤1.55, high >1.55. Dots are OR adjusted for age, gender, passive smoking and paternal or maternal history of asthma and allergic diseases; bars are 95% CIs.

