
Figure 1.
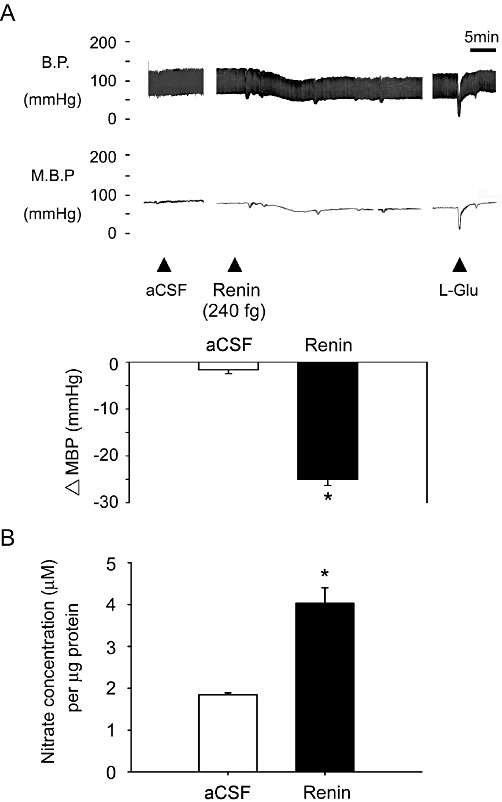
Systemic blood pressure (BP) and NO production in the NTS after administration of renin to the NTS. (A) Representative tracing show the depressor effect after unilateral microinjection of renin (240 fg) into the NTS. Artificial cerebrospinal fluid (aCSF) as the drug vehicle did not change blood pressure. Summary data (means ± SEM, n= 6) are shown in the graph. *P < 0.05, significantly different from the aCSF group. (B) Levels of NO in samples of the NTS after microinjection of renin. The bar graph shows the NO concentration (as µM nitrate per µg of total protein). Pretreatment with renin significantly elevated NO levels in the NTS compared with aCSF. *P < 0.05, significantly different from the aCSF group.