
Figure 1.
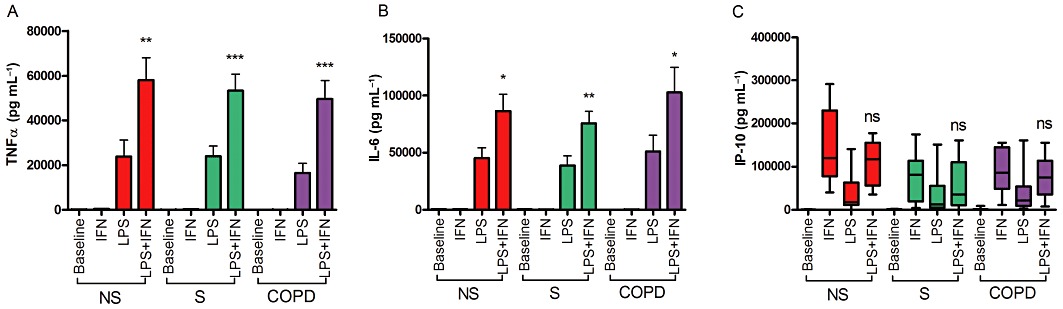
IFN-γ enhancement of LPS-stimuled AM from NS, S and COPD subjects. AM were treated with or without IFN-γ (100 ng·mL−1) for 16 h before stimulation with LPS (1 µg·mL−1) for 24 h. Culture supernatants were analysed for TNF-α (A), IL-6 (B) and IP-10 (C) levels by elisa. NS n= 8; S n= 8; COPD n= 7. Intragroup analysis was by repeated measures anova with Bonferroni post-test for TNF-α and IL-6, and Friedmen with Dunn post-test for IP-10. For all groups TNF-α and IL-6 anova results P < 0.0001. Friedmen results for IP-10 were P < 0.0002 for all groups. Intergroup analysis was by one-way anova or Kruskal–Wallis tests, with all results being non-significant. Post-test analysis results shown for LPS versus LPS + IFN-γ*P < 0.05; **P < 0.01; ***P < 0.001. Data presented as mean ± SEM for TNF-α and IL-6, and median, with whiskers showing total range, for IP-10.