
Figure 1.
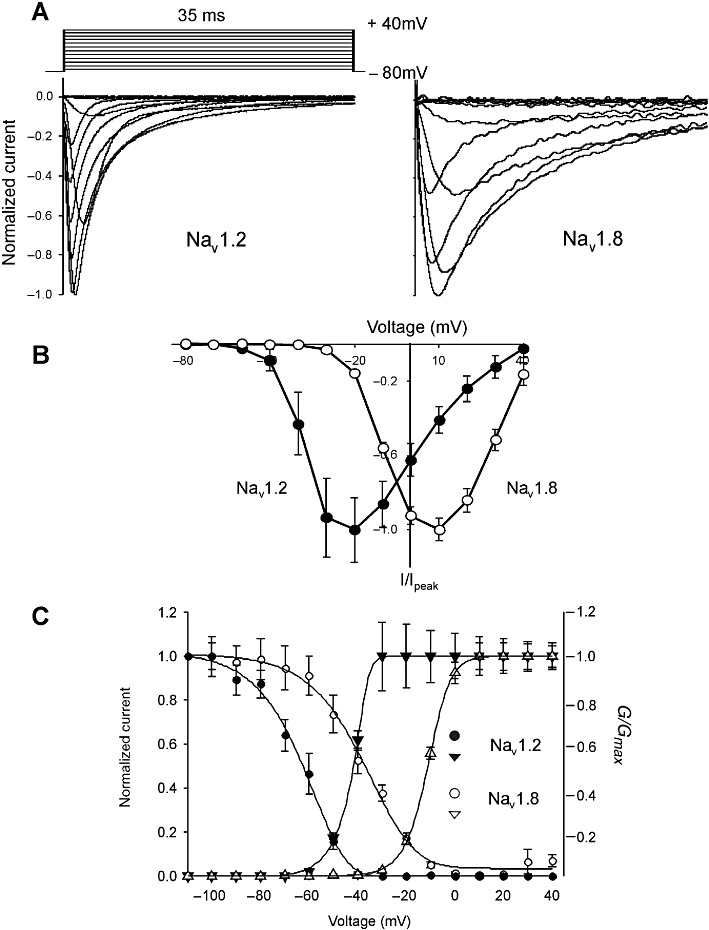
Depolarization-activated Na+ currents elicited in Xenopus oocytes expressing Nav1.2 and Nav1.8. (A) Representative normalized depolarization-activated Na+ currents in oocytes expressing Nav1.2 and Nav1.8. Oocytes were held at −80 mV and depolarized to membrane potentials ranging from −80 to +40 mV in 10 mV increments. (B) Current–voltage relationships obtained for Nav1.2 and Nav1.8. Oocytes were depolarized to voltages ranging from −80 to +40 mV in 10 mV increments, from a holding potential of −80 mV. Normalized peak currents (I/Imax) of Nav1.2 (n= 15) and Nav1.8 (n= 23) plotted as a function of membrane voltage. (C) Voltage-dependence of inactivation. Oocytes were held at −110 mV before a 550 ms conditioning pre-pulse was applied to potentials ranging from −110 to +50 mV, followed immediately by a depolarizing pulse to +10 mV. Data are represented as the Na+ current amplitude recorded after a pre-pulse to different voltages (I) relative to the Na+ current amplitude recorded after a pre-pulse from −110 mV. Voltage-dependence of activation was determined by applying depolarizing pulses from a holding potential of −80 mV to potentials ranging from −80 mV to +40 mV in 10 mV increments. Voltage-dependent Na+ conductance (G) was determined from transformations of current–voltage relationship (I–V) curves. Data obtained for Nav1.2 (n= 20); Nav1.8 (n= 27) are represented as mean ± SEM.