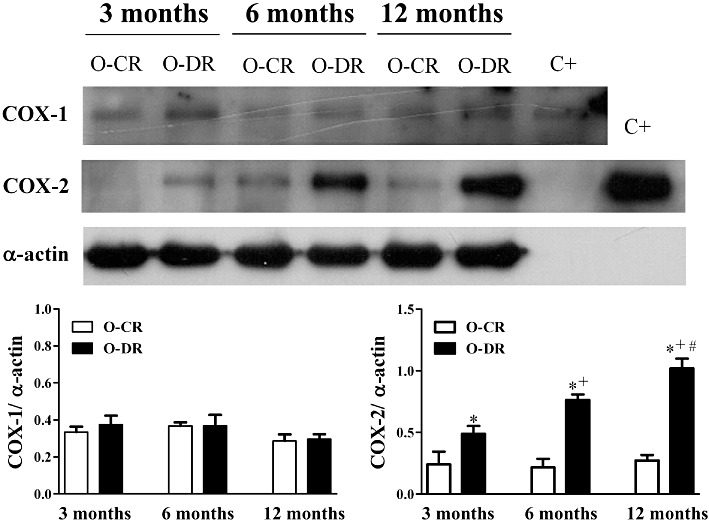
Figure 6.

Representative Western blot for COX-1, COX-2, α-actin protein expression and the positive control (C+) for COX-1 and COX-2 in mesenteric resistance arteries from 3-, 6- and 12-month-old offspring of control (O-CR) or diabetic (O-DR) rats (upper panel). Graph shows densitometric analysis of the Western blot for COX-1 and COX-2. Results (means ± SEM) are expressed as the ratio between the signal for the COX-1 or COX-2 protein and the signal for α-actin. n= 6 animals in each group. anova: *P < 0.05 O-DR versus age-matched O-CR; +P < 0.05 6-month-old O-DR versus 3-month-old O-DR; #P < 0.05 12-month-old O-DR versus 6-month-old O-DR.
