
Figure 6.
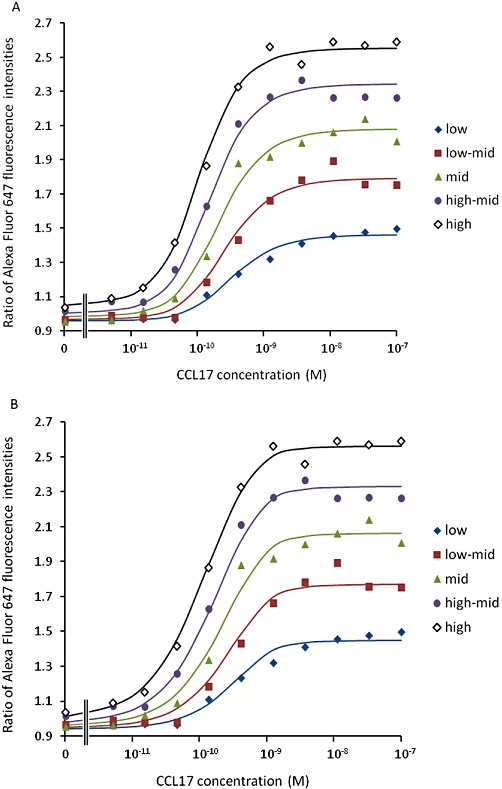
The fit of equations (A) 6 and (B) 12 to the T cell actin polymerization data. Data from the same representative experiment are shown in each case. The solid lines are the curve fits. A single determination of the effect of each concentration of agonist was made.