
Figure 3.
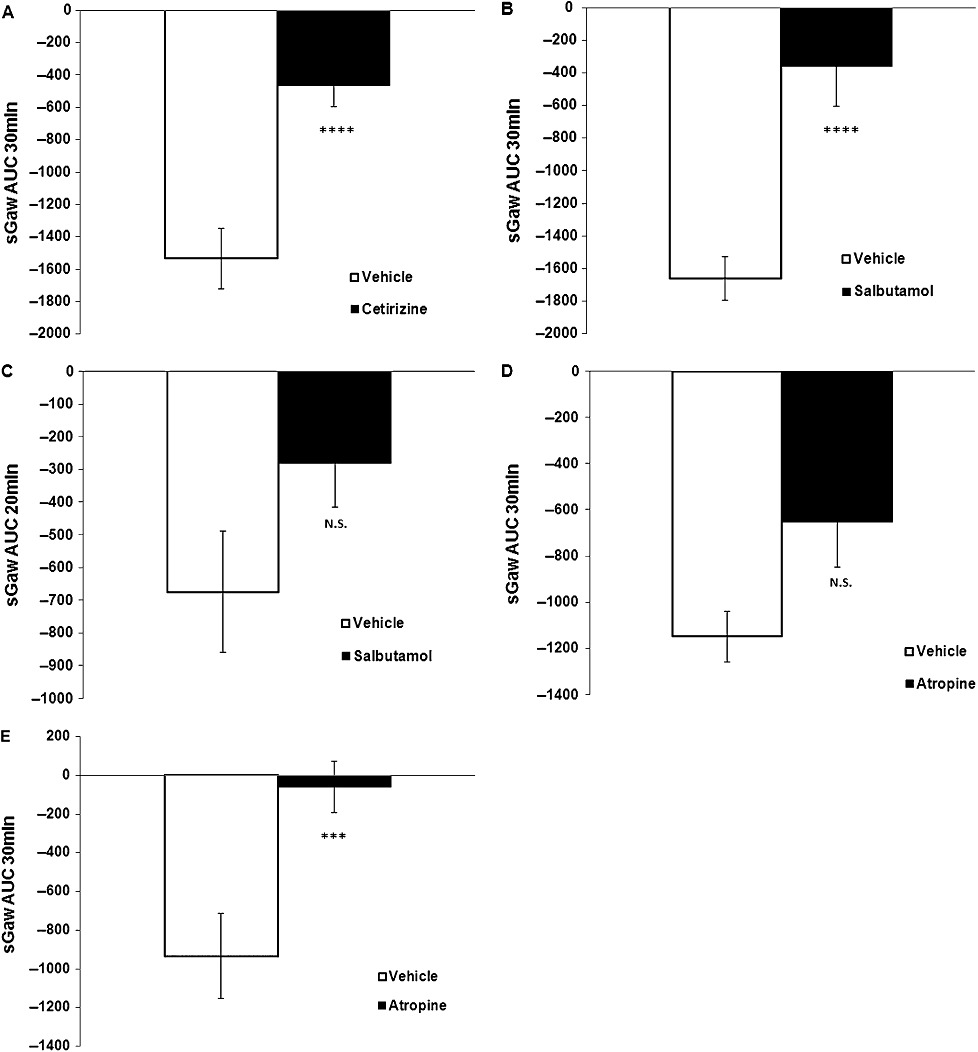
(A) Effect of cetirizine 10 mg·kg−1 i.p. (n = 6) on OA-evoked bronchoconstriction (sGaw AUC for 30 min = −463 ± 132) compared with saline 1 mL·kg−1 i.p. (n = 6) (sGaw AUC for 30 min = −1533 ± 185). Animals dosed 1 h before OA. Negative sGaw AUC ± SEM values show a bronchoconstriction. ****P < 0.001: significant inhibition of 70%. (B) Effect of salbutamol 3 mg·mL−1 i.t. (n = 8) on OA-evoked bronchoconstriction (sGaw AUC for 30 min = −359 ± 246) compared with saline 100 µL per animal i.t. (n = 10) (sGaw AUC for 30 min = −1661 ± 133). Animals dosed 1 h before OA. Negative sGaw AUC ± SEM values show a bronchoconstriction. ****P < 0.001: significant inhibition of 78%. (C) Lack of effect of salbutamol 3 mg·mL−1 i.t. (n = 8) on OA-evoked AHR to a subthreshold dose of histamine (sGaw AUC for 20 min = −282 ± 135) compared with saline, 100 µL per animal i.t. (n = 10) (sGaw AUC for 20 min = −674 ± 186). Animals were dosed 2.5 h before histamine. Negative sGaw AUC ± SEM values show a bronchoconstriction. P > 0.05: non-significant inhibition of 58%. (D) Lack of effect of atropine 10 mg·mL−1 i.p. (n = 8) on OA-induced bronchoconstriction (sGaw AUC for 30 min = −652 ± 199) compared with saline 1 mL·kg−1 i.p. (n = 8) (sGaw AUC for 30 min = −1150 ± 110). Animals were dosed 1 h before OA. Negative sGaw AUC ± SEM values show a bronchoconstriction. P > 0.05: non-significant inhibition of 43%. (E) Effect of atropine 10 mg·mL−1 i.p. (n = 8) on OA-evoked AHR to histamine (sGaw AUC for 30 min = −60 ± 133) compared with saline 1 mL·kg−1 i.p. (n = 8) (sGaw AUC for 30 min = −935 ± 219). Animals were dosed 1 h before OA and 2.5 h before AHR to a subthreshold dose of histamine. Negative sGaw AUC ± SEM values show a bronchoconstriction. ***P < 0.005: significant inhibition of 94%.