
Figure 7.
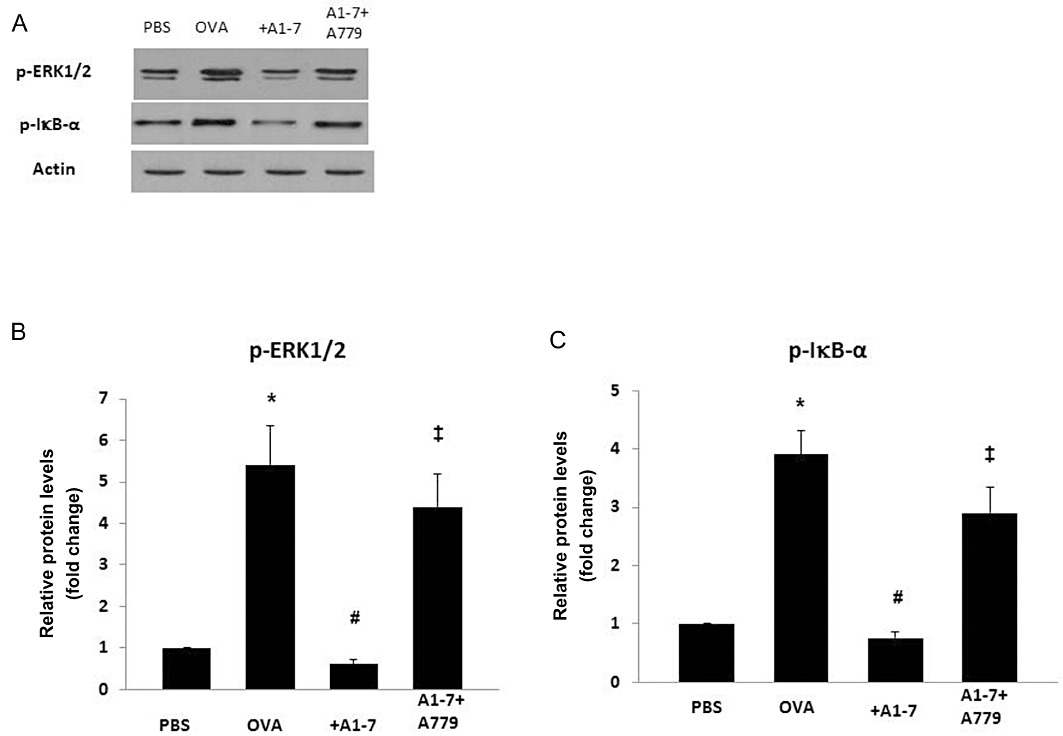
Western blot analysis of p-IκB-α and p-ERK1/2 protein levels from lungs of PBS-challenged mice pretreated with vehicle (PBS), from ovalbumin (OVA)-challenged mice pretreated with vehicle (OVA), Ang-(1–7) and A779 plus Ang-(1–7). Representative blots (A) and densitometric quantification of at least three independent experiments (n = 3) showing relative levels of p-ERK1/2 (normalized to β-actin) (B), and relative levels of p-IκB-α (data normalized to β-actin shown as a ratio of phosphorylated to total IκB-α protein) (C). Data shown represent the mean ± SEM. *P < 0.05 versus time-matched PBS-challenged mice. #P < 0.05 versus time-matched ovalbumin-challenged mice. ‡P < 0.05 versus time-matched Ang-(1–7)-treated ovalbumin-challenged mice.